Generating A Pokémon Types Table In Python
Hi there. This page is on generating a Pokémon types table in the Python programming language. You can create something similar to the table below.

I have made one of these Pokémon types table in the R programming language in the past in an old Steemit post. This one is focused on making one with the Python programming language. The original page for this post is here.
Setting Up The Pokémon Types Table
The code to generate the table plot with Python is not that long. Start with importing seaborn as sns, numpy as np and matplotlib's pyplot as plt.
A list of Pokémon types (Generation 6+) is created into Python. This list will be for the plot labels.
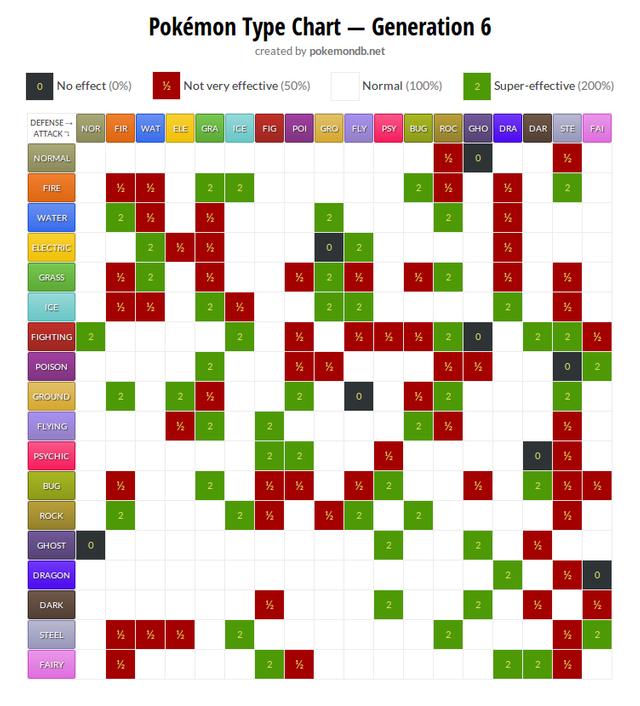
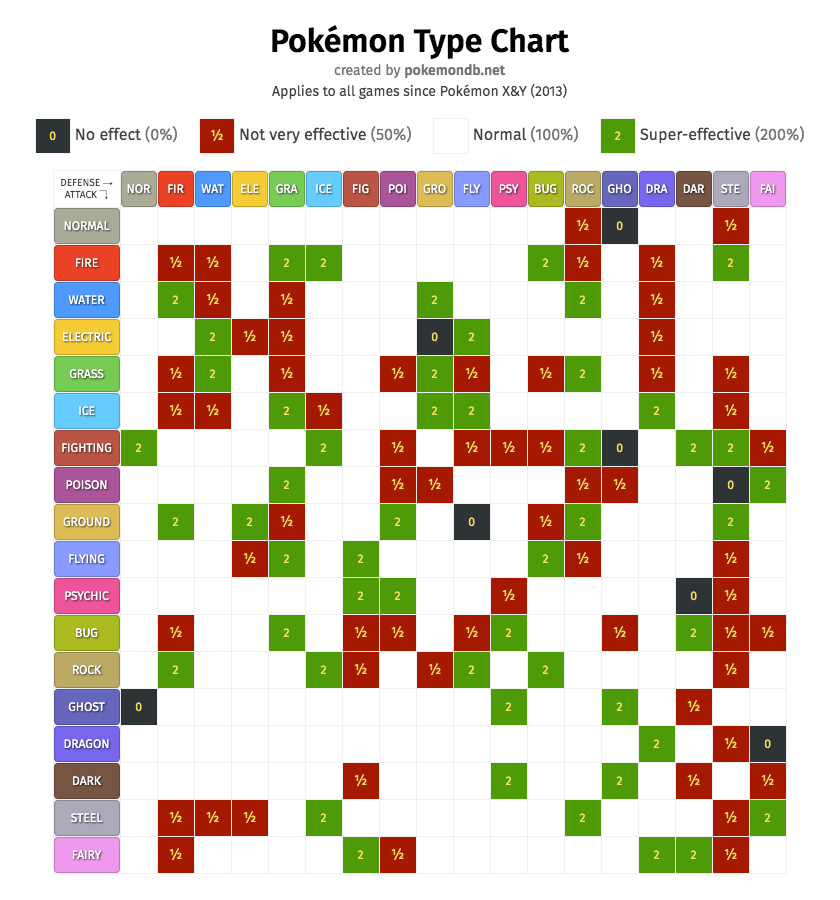
The part that takes a while to set up is the two-dimensional Numpy array. Numeric values are either 0, 1/2, 1 or 2. This Numpy list is a replication of the Pokémon table chart above.
Refer to the list below for the number meanings.
- 0: Attack type does no damage to the defending Pokémon
- 0.5: Attack Of that type does half the normal damage to the defending Pokémon
- 1: Attack Of that type does normal damage to the defending Pokémon
- 2: Attack Of that type does double the normal damage to the defending Pokémon
Note that the list above refers to single type defending Pokémon and not dual typed ones. For dual typed defending Pokémon use the chart twice. As an example, a fire type move on a Water/Dragon Pokémon would do one quarter of the normal damage because of half damage from fire to water and another half damage from fire to dragon. (0.5 x 0.5 = 0.25)
### A Pokemon Types Table Plot In Python
### Seaborn Approach:
# References:
# https://stackoverflow.com/questions/33158075/custom-annotation-seaborn-heatmap
# https://stackoverflow.com/questions/40734343/artificial-tick-labels-for-seaborn-heatmaps
# Pokemon Type Table Reference: https://img.pokemondb.net/images/typechart.png


import seaborn as sns
import numpy as np
from matplotlib import pyplot as plt

pokemon_types = ["Normal", "Fire", "Water", "Electric", "Grass", "Ice",
                 "Fighting", "Poison", "Ground", "Flying", "Psychic",
                 "Bug", "Rock", "Ghost", "Dragon", "Dark", "Steel", "Fairy"]

# A 2 Dimenstional Numpy Array Of Damage Multipliers For Attacking Pokemon:

damage_array = np.array([[1, 1, 1, 1, 1, 1, 1, 1, 1, 1, 1, 1, 1/2, 0, 1, 1, 1/2, 1],
                    [1, 1/2, 1/2, 1, 2, 2, 1, 1, 1, 1, 1, 2, 1/2, 1, 1/2, 1, 2, 1],
                    [1, 2, 1/2, 1, 1/2, 1, 1, 1, 2, 1, 1, 1, 2, 1, 1/2, 1, 1, 1],
                    [1, 1, 2, 1/2, 1/2, 1, 1, 1, 0, 2, 1, 1, 1, 1, 1/2, 1, 1, 1],
                    [1, 1/2, 2, 1, 1/2, 1, 1, 1/2, 2, 1/2, 1, 1/2, 2, 1, 1/2, 1, 1/2, 1],
                    [1, 1/2, 1/2, 1, 2, 1/2, 1, 1, 2, 2, 1, 1, 1, 1, 2, 1, 1/2, 1],
                    [2, 1, 1, 1, 1, 2, 1, 1/2, 1, 1/2, 1/2, 1/2, 2, 0, 1, 2, 2, 1/2],
                    [1, 1, 1, 1, 2, 1, 1, 1/2, 1/2, 1, 1, 1, 1/2, 1/2, 1, 1, 0, 2],
                    [1, 2, 1, 2, 1/2, 1, 1, 2, 1, 0, 1, 1/2, 2, 1, 1, 1, 2, 1],
                    [1, 1, 1, 1/2, 2, 1, 2, 1, 1, 1, 1, 2, 1/2, 1, 1, 1, 1/2, 1],
                    [1, 1, 1, 1, 1, 1, 2, 2, 1, 1, 1/2, 1, 1, 1, 1, 0, 1/2, 1],
                    [1, 1/2, 1, 1, 2, 1, 1/2, 1/2, 1, 1/2, 2, 1, 1, 1/2, 1, 2, 1/2, 1/2],
                    [1, 2, 1, 1, 1, 2, 1/2, 1, 1/2, 2, 1, 2, 1, 1, 1, 1, 1/2, 1],
                    [0, 1, 1, 1, 1, 1, 1, 1, 1, 1, 2, 1, 1, 2, 1, 1/2, 1, 1],
                    [1, 1, 1, 1, 1, 1, 1, 1, 1, 1, 1, 1, 1, 1, 2, 1, 1/2, 0],
                    [1, 1, 1, 1, 1, 1, 1/2, 1, 1, 1, 2, 1, 1, 2, 1, 1/2, 1, 1/2],
                    [1, 1/2, 1/2, 1/2, 1, 2, 1, 1, 1, 1, 1, 1, 2, 1, 1, 1, 1/2, 2],
                    [1, 1/2, 1, 1, 1, 1, 2, 1/2, 1, 1, 1, 1, 1, 1, 2, 2, 1/2, 1]])
Creating The Pokémon Types Table
Most of the hard work has been done. Generating the plot does not require too much code. From my own (Google) research, it is easier and better to use Seaborn for plotting heatmaps with labels than with matplotlib.
The main function that is used is Seaborn's heatmap() function. It it key to use the annot = argument along with the xticklabels and the yticklabels. The argument cmap = "Greens" is for having the colours in the green shade.
Labels and a title with changed sizes are added to the plot.
fig, ax = plt.subplots()
ax = sns.heatmap(damage_array, annot = damage_array, fmt = '', cmap="Greens",
                 xticklabels = pokemon_types, yticklabels = pokemon_types)

ax.set_xlabel("\n\n Defending Pokémon", size = 14)
ax.set_ylabel("Attacking Pokémon \n\n", size = 14)
plt.title("A Pokémon Type Chart - Generation 6 \n\n", size = 18, color = "#b30000")
plt.show(fig)
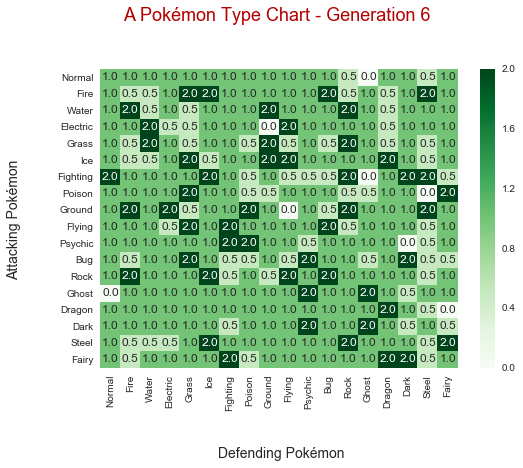
This plot comes out nicely and the labels help the viewer see which attack types work well against different defending Pokémon types. Remember that the table would be used twice for dual-typed defending Pokémon.