Statistics don't lie, people do
As a statistics fan it can get very frustrating browsing around the web or listening to the news. For such an important branch of math, there are still a lot of misconceptions about statistics which can have consequences ranging from small stuff such as blowing up a piece of news to actually killing people (yep I'm not exaggerating).
The reality is that for most jobs a basic sense of statistics is vital even if the job has nothing to do it with science or mathematics. For example someone who studied journalism because he/she didn't want to do anything with math and is reporting a story about crime increasing in a town, local elections or even the weather, it is necessary to at least have a general sense of statistics. It is misleading to say "crime has dropped 20% from the last month because the police department increased their headcount" without asking some questions. What was the size of the sample? Is there a correlation between police headcount and crime? If so what is it? Is crime in that city cyclical? As I will explain later, not thinking about all this makes the information incomplete and misleading. By exploiting this lack of knowledge politicians, news providers, pharma companies and others, can get away with a lot of things that technically may be but statistically are nonsense. As consumers of information and products it is important that we are familiar with a few simple, yet important, concepts of statistics to not let ourselves get fooled.
Sample size is key
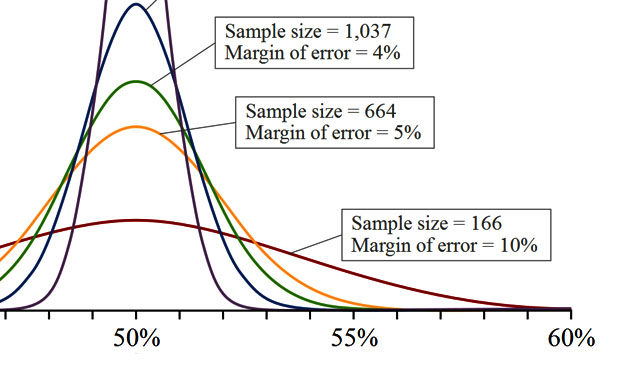
Saying that crime has dropped 20% sounds like a good thing, however if I also were to tell you that we are looking at a small town in which the number of robberies dropped from 5 to 4 in a month it doesn't look as significant, it could be just a meaningless random variation. In statistics the larger the sample size the more accurate the results. A small sample size leaves you exposed to outliers, even more if you are looking at a heterogeneous population where a small sample may not be able to capture a representative part of the population.
In regards to the sample size it is important to keep in mind how the size of the sample relates to the population in general. Looking at 100 items which a certain factory produces could be significant if we are looking at a car manufacturer which can make a dozen cars a day but meaningless if we are looking at a Pepsi plant which can produce millions of cans a day. When dealing with statistical data it is important to understand what is the sample we are looking at? Is it representative of the population? Are the results we are being presented significant?
Understanding the cyclicality of the data
Let's say we are looking a business that had 3 excellent months and suddenly the revenue dropped by more than half for the next 6 months. It may be statistically significant enough to say that revenues are on a down trend and that the company should be worried about their future outlook. However what if that business is a ski rental company in Colorado? It sells out during the few months that there is snow and then waits until the next snow season. It is important to understand the cycles of a data set.
Cycles could be short or can last years, which is something economists and politicians tend to exploit. It is very easy to take credit for an improvement on the economic conditions for a recently elected politician when it could be part of a larger positive cycle or using the drop in crime in the city, it could be that some months have more crime than others (Usually in vacations the crime rate is lower)
It is important to understand the background of the data we are being presented in order to determine if the statistics or trends provided make sense or not.
Correlation does not mean causation
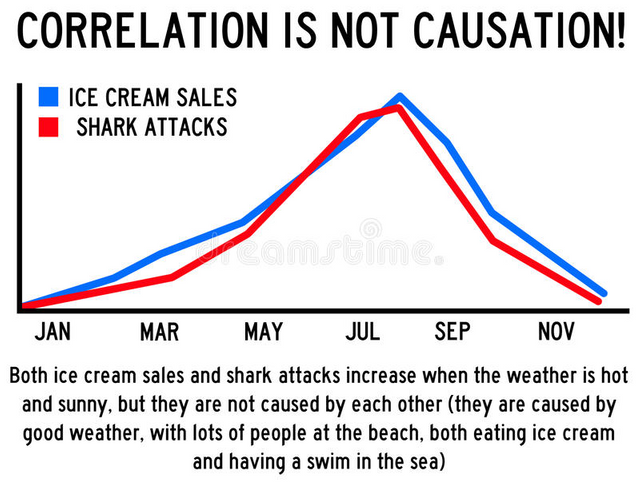
This is one of the principal misconceptions when people "analyze data". Just because two individual things occur at the same time doesn't mean one causes the other. If you look long enough at different data sets you can find hundreds of correlations, however that doesn't mean they have anything to do with each other or that the correlation will hold in the future. For example if there is a positive correlation between shark attacks and ice cream consumption it doesn't mean that one causes the other. It could be a third factor that causes both, for example days that are sunny may be better for people to go to the beach and swim as opposed to rainy days and independently most people prefer to have ice cream on a warm and sunny day. Even then this correlation could be attributed to other smaller factors, to be able to determine causation will require to dive deeper and do more research which for most examples in real life is hard to do as some events cannot be repeated or tested in a vacuum. It can also be the case that there is no correlation and this was just a random anomaly that caused those 2 unrelated data sets to look alike for a set period of time.
It happens often that news take advantage of this and try to create links when there are none. It is better for a story to say that the market went up due to "insert recent event" than to say there it did due to unexplained random variations that occur in the market. Correlation does not mean causation, just because two events happened together doesn't mean one is caused by the other.
https://bzfd.it/2udbg10 (link with 10 ridiculous correlations)
Beware of predictions
Using statistics (and probabilities) loosely can lead to false outcomes. There is no problem with people making predictions as long as the people who read them understand that some times there is just a probability of it happening and most likely the predictions are rubbish as accurate as a psychic guessing the future. Common red flags to look for in when looking at predictions are:
The source - Anyone can claim to be an expert on any field, and even then just because someone made a successful prediction in the past doesn't mean future success.
The specifics - A prediction with no specifics is the equivalent of guessing. Are there any time frames? What are the chances of it happening? Is there an specific target? Also worth noting that it is a lot more accurate to give a range as a target than just throw a number (Saying that the price of a stock will be within $77-$80 in 6 months as opposed to claiming that the stock price will reach $79)
The reasoning - If someone is making a prediction then there must be some kind of evidence or reason behind that prediction. When the weatherman gives the forecast it is based on a model that analyzes the present conditions and other factors, same as when a pharmaceutic company claims that their pill will increase your likelihood of survival we would expect to be a study to back the prediction (not necessarily the case and the sample size used on those studies is usually one of the things that statisticians complain about these studies).
There are many other things to keep in mind when looking at statistics, predictions and probabilities but the ones outlined here are some of the most important to have present when looking at the news or making decisions based on claims from others. It is extremely easy to fool people or make up numbers to back claims that may be ridiculous so it is important to always remain skeptic and use the principles above.
Below is one example of a terrible use of statistics and predictions.
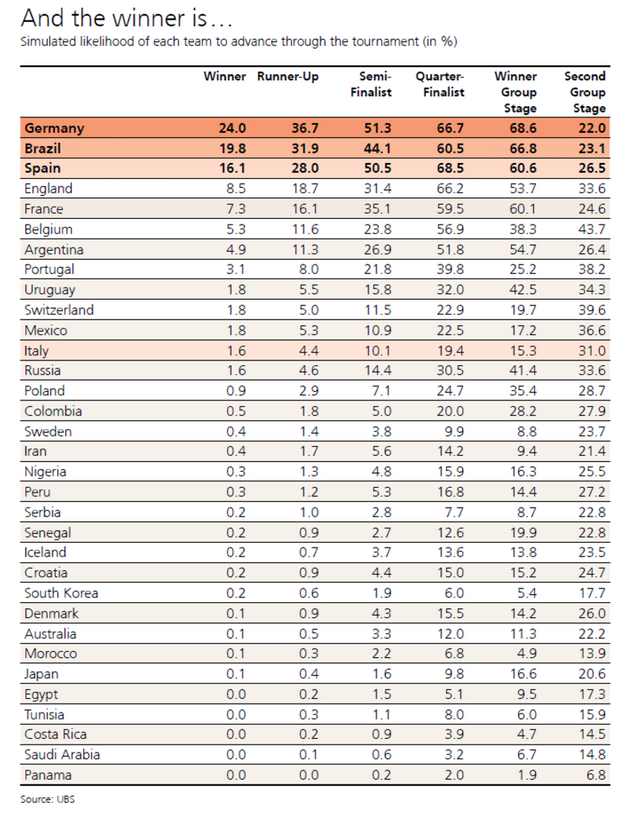
This chart was done by a team of 18 analysts in UBS and presented with a 17 page report. They claimed to use a computer simulation to predict the winner of the World Cup by running the model 10,000 times. The prediction was Germany to win it all with 24%. At a first glance there seems to be nothing wrong with the model as Germany is a strong team coming from winning it all but the further you look the worse they look (even if we discard the fact that their top 3 teams with a combined 60% chance of winning it all didn't make it to the semifinals).
Germany has a 90% chance of advancing the group stage which seems reasonable, but from there it gets a bit more complicated. Their simulation states that there is a 66.7% chance of Germany advancing to the quarterfinal, implying that they have a 73.6% chance of winning in the round of 16 (0.90 times 0.736 gives you the 66.7%) which is in line with their historical record of 72.9% and considering they are a strong team sounds fair. Then they have a 51.3% chance of making it to the semifinal, implying that they have a 77% chance of winning in the quarterfinal, how come is the quarterfinal easier than the round of 16? Without knowing the rival it is odd claiming that for Germany it is going to be easier to win in the quarter final when it the odds are that they would be facing a strong rival like England, Belgium or Brazil (all in the top 6 in their simulation). Also they are implying that Germany have better odds of winning a game against one of the 8 finalists in the world cup than their historical winning %. Same thing for the runner-up which gives them a 71.5% chance of winning the semifinals and 65% to win the finals.
UBS's model is saying that Germany has the same likelihood of winning in the semifinals than what they would have winning their average game, however that is not a regular game, it will be against top competition. If we look at Germany's record against the top 8 teams that have more than 15% chance of making it to the semifinal (Brazil, Spain, England, France, Belgium, Argentina, Portugal and Uruguay) they have a record of 56% which is good but not the 65% or 71% which UBS is giving them. Considering that they were expected to have a strong team you could make a case that they would be better than their average historical % but going from 56% to 65% is the difference between a team like Poland (57%) and Argentina (66%).
This quick analysis is just a small exercise to show how 18 Analysts from UBS and a 10,000 simulation model was way off in what should be a not so complex model. In this case they overestimated the chance of a few favorites (In adition to Germany, there was Spain and Brazil). I wouldn't imagine how would their predictions look for an economic forecast that takes a lot more variables.
Congratulations @mvaisberg! You have completed the following achievement on Steemit and have been rewarded with new badge(s) :
Click on the badge to view your Board of Honor.
If you no longer want to receive notifications, reply to this comment with the word
STOPDo not miss the last post from @steemitboard:
SteemitBoard World Cup Contest - Home stretch to the finals. Do not miss them!
Participate in the SteemitBoard World Cup Contest!
Collect World Cup badges and win free SBD
Support the Gold Sponsors of the contest: @good-karma and @lukestokes