The Story Of Two Candles
I love stories. Good, enticing, well written (or told) stories that can keep you glued to the book until the very last page. And I do believe we can find stories everywhere, if we really look.
We can find a good story even in the dullest and driest place in the world: a STEEM price chart.
Because, you know, there's a really interesting story in the chart below:
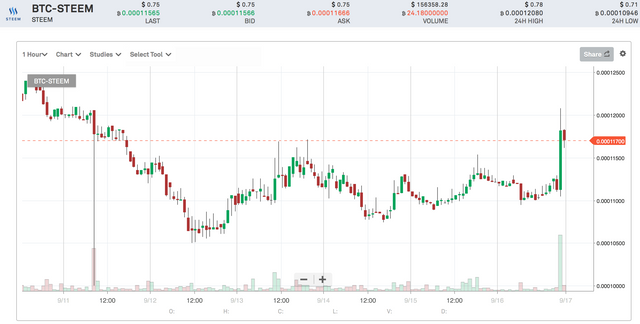
That's a snapshot of the hourly STEEM price on Bittrex, taken about an hour ago (not much changed since, if you're wondering).
So, what's the story?
Well, if you look on the left side of the chart, you'll notice a really, really, really long red candle, which took STEEM from 12k satoshis down to 10k satoshis, and then recovered up to 11.7k satoshis. All in one hour. That's quite a crazy swing, especially looking at the volume, which is the second largest in the timeframe selected.
The largest volume, though, in the timeframe selected, happened on a really big green candle, which took the price from 11.3k satoshis up to 12k satoshi, and then corrected down to 11.8k satoshis.
The red candle happened on a 9 BTC volume.
The green candle happened on a 12 BTC volume.
I can imagine somebody saying something like that:
"Well, let's dump hard 9 BTC worth of STEEM on Bittrex and see what happens. I bet we can really drive the price quite low."
And indeed they did drive the price lower, not quite to 10k satoshi, but they touched a 11k low twice. Quite the sell-off.
And then, I can imagine the same guy saying something like: "If I will buy back all the STEEM I dumped a couple of days ago, I can still make a decent profit. 10% to 20% more STEEM in my bag. Not bad for a two days trade. Especially if I know, by chance, that STEEM price will go even higher."
And there you go with a huge green candle, driving the price almost at the same point when it was when the red candle exploded.
But then, again, all this is speculation. Just a nice bed-time story.
Right?
I'm a serial entrepreneur, blogger and ultrarunner. You can find me mainly on my blog at Dragos Roua where I write about productivity, business, relationships and running. Here on Steemit you may stay updated by following me @dragosroua.

Wanna know when you're getting paid?

|
I know the feeling. That's why I created steem.supply, an easy to use and accurate tool for calculating your Steemit rewards |
Well, that selling red (bear) candle represents many trades, maybe just one big whale selling but a bunch of counterparts buying smaller parts of that trade at many different prices. The opposite happened with the green (bull) candle. So the whale will end up with an average selling price and an average buying price which looking at the chart could perfectly be a small loss instead of a gain if he/she did not play well the trades.
I also like the tables. It will be interesting to see if Steem can hold .70. I don't think it will.
https://coinmarketcap.com/currencies/steem/historical-data/
Oh no!
Now, i am on the edge of my seat!
What happens next?
Bittrex won't let me turn the page and find out!
I think that is so mean.
Mean, indeed :)
It could perfectly be... this long candles are mostly indicating one whale playing with the market... I was thinking the same
It wouldn't surprise me if that's exactly what happens. The huge swings in volume normally indicate that it's one person making the move, unless it's sustained because people are panicking and dumping. Most of us don't have that kind of account. We just ride the waves and keep on posting.
It could be some buy pressure from upcoming HF20 rollout on 25th September.
Come to think of it, you're very right, in some corner this is what is happening behind the candles.
I think an interesting concept here is how thinly traded Steem has been of late that these moves could be more common. If you look at the amount of volume on Bithumb you wouls be amazed on the way it trades at such a premium. However, I think this is due to the fact that only about 18-20% of liquid Steem is on exchanges and the the fact that most Steem remains staked which will be good for the long term.
I don't find candles boring at all. Especially when sSteem is involved because I'm either going yeah it's going up or holy crap it's going down.
Hopefully, The story will continue like this and in December we will have steem at 10$.