Evolution of my STEEM POWER: Pushing hard the accelerator pedal!
Since I started in STEEMIT on June last year I have done a total of four investments in STEEM.
Yes, only four.
One, the biggest one till now, on October last year, when the price of STEEM was around 0.8USD. There, I bought a total of 1048 STEEM paying about 850 USD...
Then I did two minors buys as well, the first one on early March this year, getting 50 STEEM at a non very cheap price of 3.36 USD (168 USD) and the second on early April just at the first deep of this long correction. There I bought 260 STEEM at 1.6 USD (416 USD).
Last has been on mid August when I spent 400 USD and I get 565 STEEM.
So in total, my investment on STEEM has been of 1923 STEEM, paying a total 1834 USD, which perhaps doesn't look a good deal because the average price of my STEEM buys right now is around 0.95 USD and, knowing the price of STEEM today, seems expensive... but it is not!
All that STEEM which I bought went directly to increase my STEEM POWER.
- The following is a chart on the evolution of my SP:
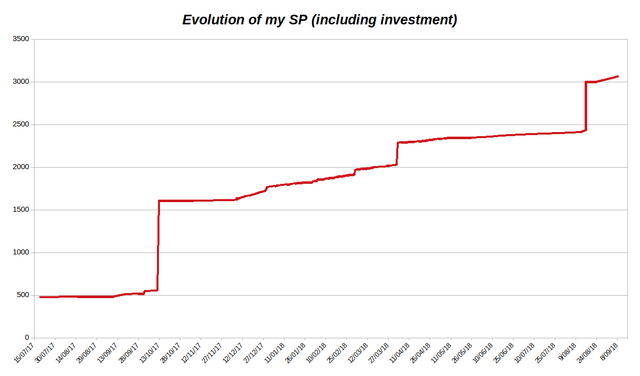
You can notice the date on which the "major" investment were done, around October 2017 the 13th and August 16th this year.
- The following chart is the same but subtracting the three investments so you can see how the SP has increased "naturally".
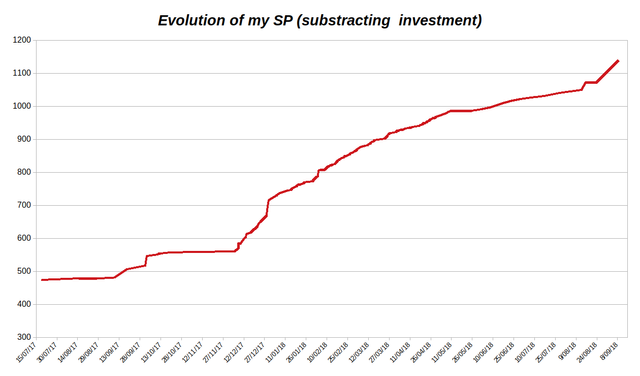
As you can see, my STEEM POWER has been continuously increasing since then, however I've been also enjoying the profits obtained by posting at the STEEMIT platform so, not all the SBD and STEEM earned during all these time has been Powered Up.
I have changed my "SP BUILDING" strategy depending on the price and the situation of the whole market.
On December and January, the price of STEEM was so good that I destined only 25% of my earned SBD and STEEM for powering up. The other 75 % went for getting profits and I used for many things as creating new projects (@runningproject and @isotonic are one of them, helping steemians to grow up, creating new accounts for friends, trading afterwards and get some cash as well. Nonetheless, the market was so good that even designing a smaller portion of the liquid rewards to increase the SP, the amount of SP generated was still very high...
As long as the correction was running, I have been changing the strategy, assigning more proportion of my earnings to build my SP.
The following is a chart showing graphically the Rate of SP generated a day for each month.
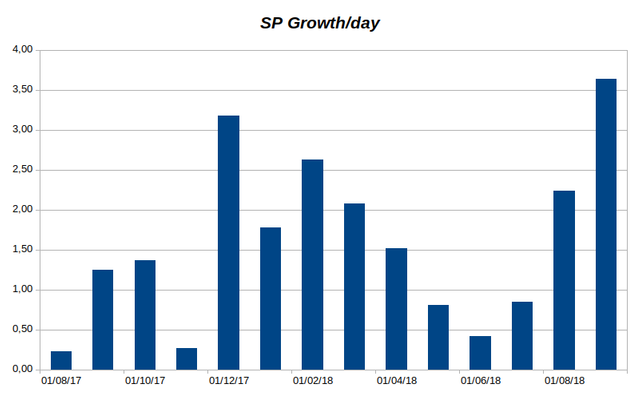
As you can see, since February this year I have being assigning less and less earnings for SP increasing. I have passed from a maximum rate of 3.18 SP/day on December, to "peanuts" on early June...
Since June's Rate Bottom my strategy has changed, so I am pushing the SP pedal again...
... I am increasing the proportion of liquid STEEM being Powered-up versus withdrawals to the 80 or 90% of my weekly earnings.
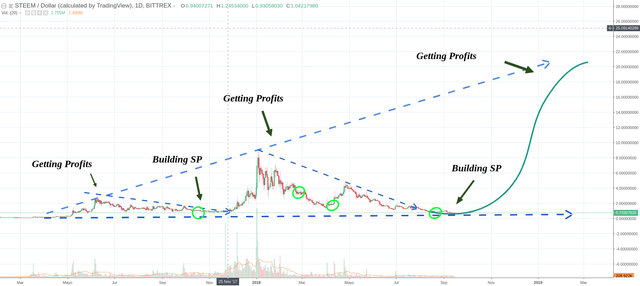
Strategy is everything in this game, there are times for Getting profits, earn some good SBD or STEEM, withdraw them, if you want, to your favorite exchange, get BTC or USD or buy other interesting Cryptos.... while there are times on which the best is to accumulate and build your SP as much as possible...
...the harvest will come later!
Of course, all of this is valid only if you are confident and firmly believe in the Long term success of this Blockchain and Project.
*Disclaimer: This is just my personal point of view, please, do your own assessment and act consequently.
Neither this post nor myself is responsible of any of your profit/losses obtained as a result of this information.
Published on

by toofasteddie

What tool are you using for these graphs? I asked before and you said steemworld.org (beta) but I cant see any option to do this.
You could make a great post... just telling us how you create these graphs... I would love to see mine.
Well I didn't lie you my friend ;-)
I use Steemworld to get my historical data...after extracting the file, then I post-process the data in excel and create the chart... it is not automatic, it takes time...
the means are there...the way you present is another story
Steem on
I see.. you picture tells me just enough on how to do it... thanks!
too late...I'm writing the post :-)
Good idea... will save me having to calculate the total STEEM column. I'm OK in Excel but Ill go for the bone idle method anytime ;)
I agree :) I'd love to see mine, too.
Who knows which direction the price will take.. let's hope for the best eh! 🙂👍
Posted using Partiko Android
always!