Liquid STEEM Report July 6, 2018
This is a historical graph of both Total STEEM and Liquid STEEM supply
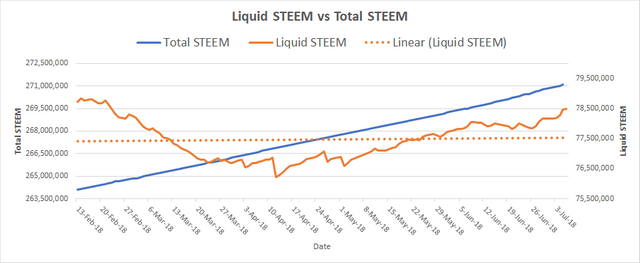
Liquid STEEM is the remaining STEEM that has not been converted into Steem Power. (Orange Line)
- When STEEM is liquid, it can be readily sold and purchased. When locked away in SP, it is not liquid, It takes a significant amount of time to convert it back to a liquid form.
The linear line (dotted line) is a line fit to the Liquid STEEM to show if Liquid STEEM is going up or down over the entire time period.
I created this chart with data that I collected over the last few months.
Why is this graph important?
STEEM is created at a high rate. Currently 8.83% per year. Many Steemians have a concern about STEEM inflation with the high rate of new currency creation. This graph shows since February, There is less total Liquid STEEM. The dotted linear trend line shows that there is curently about a break even trend for Liquid STEEM supply over the last 4 months.
I hope you enjoyed reading my Blog. Please remember to Upvote, Resteem, and Follow. Thank you.
---------------------------------------
For a breakdown of how Steemit Rewards system works:
For a breakdown of Steemit Keys:
https://steemit.com/life/@socky/do-you-understand-your-steemit-key
For a breakdown of why Steem Power is Important:
https://steemit.com/steemit/@socky/why-is-steem-power-important-beginners-read


Locking STeem will help Steem's px stable
Nice Information bro stay or working