3RD GRADE MATH - ANALYSING A BAR GRAPH
Analysing a Bar Graph - Basic Concept for 3rd Grade Math
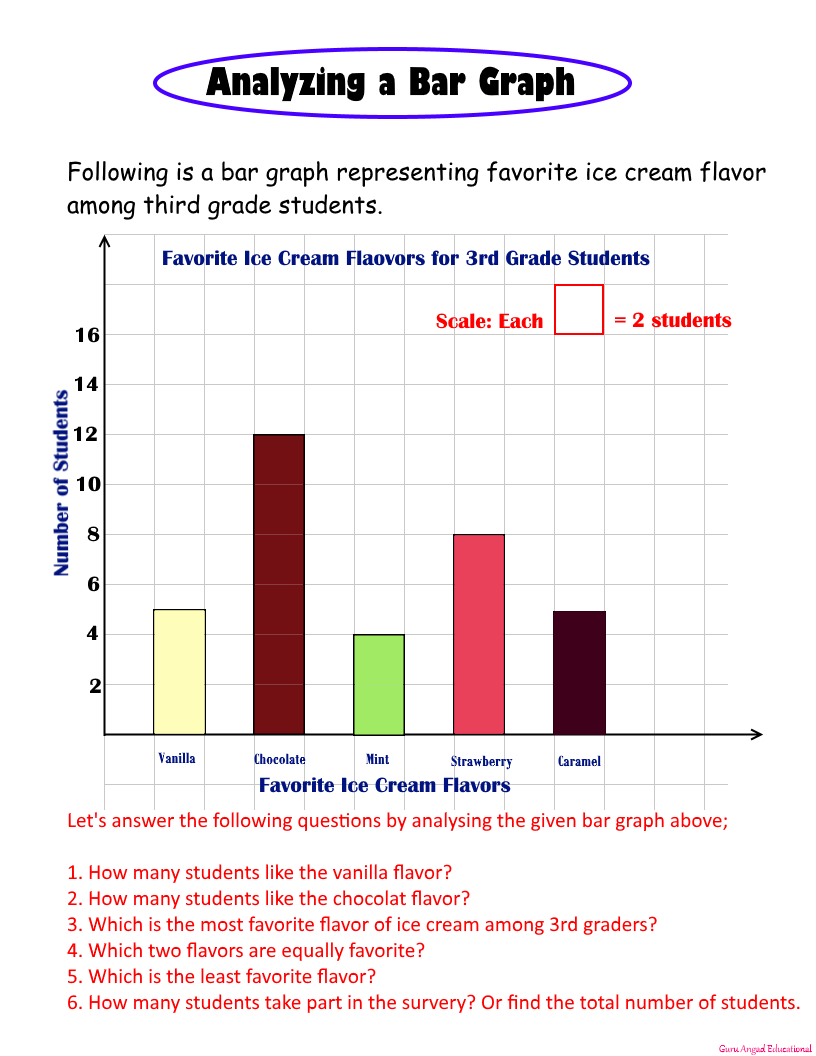
While analysing a bar graph following are the basic hints which need attention;
- The heading or label of the bar graph
- Horizontal and vertical scales and what is represented on which scale
- Intervals on the scales (i.e. counting by ones, twos, ....fives etc)
- Height of bars as compared to the vertical scale
- Highest and shortest bars.
- Bars with equal heights.
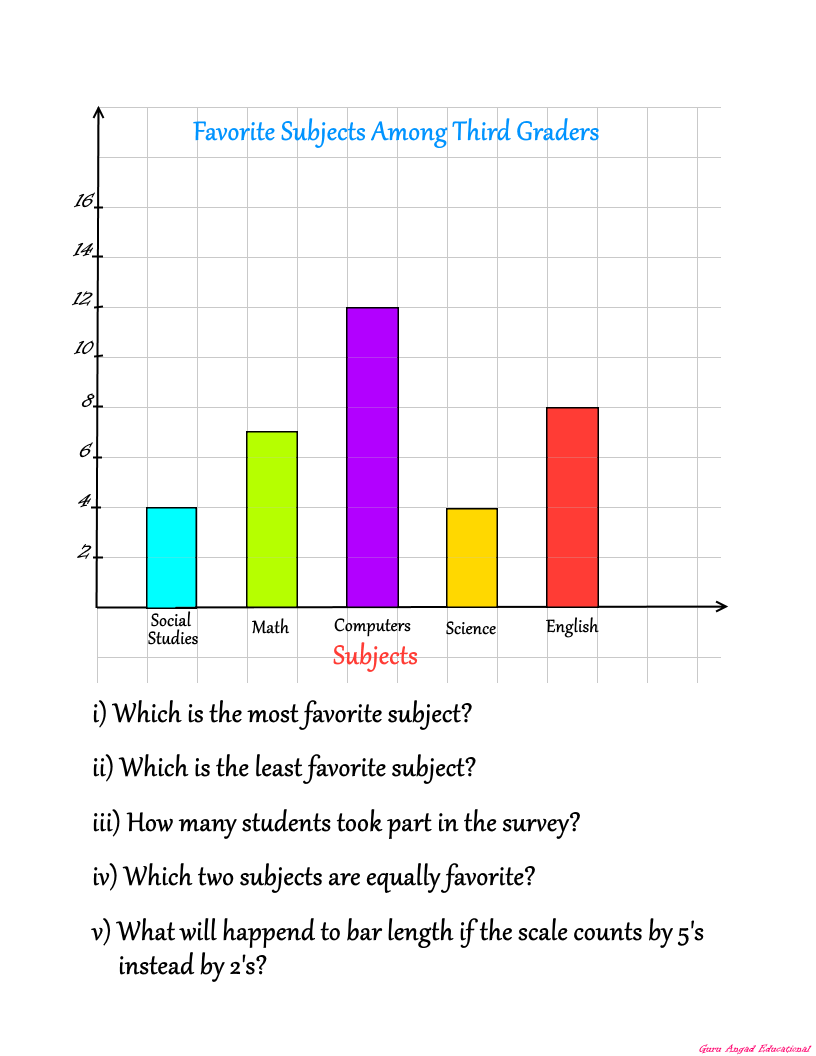
Following are the activity sheets I prepared to introduce the concept to 3rd graders;
it seems perfect to teach the little ones of analysis, this will be good for my daughter, I will be following teache many other things more ... Good post, I follow you.
I would love to have your support in my last publication. Thank you.
@mukhtarilyas, the data presented in the bar chart above is included discrete data means the number of students there are no 2.5 must be round that is 4, 5 and 12, so the data is not discrete data. so friends @mathworksheets.
Interesting educational material for primary school teachers, bars is an ideal tool to measure population distributions by age and sex ... and for many other things more ... Good post, I follow you.
I would love to have your support in my last publication. Thank you.
it seems perfect to teach the little ones of analysis, this will be good for my daughter, I will be following teacher
I like your style of learning
Greatly explained sir ..
Keep it continue sir...we r always with you sir..
Sir Actually your class is exclusive and you going to learn step by step...thanks for the good catagory post sir..

learn some new from your post..
This is awesome sir,you are a X factor in steemit education.