Currency Analysis Report 10/3/19 – Price On GBP/JPY Can Go Either Direction At This Point

Since I started trading Forex four years ago, in my search for forex news, I have compiled a list of several website that are my “go to” website for news in the currency world. This year I added a new one to the list, FXEmpire. Their analysis on forex pairs are concise and easy to understand. Thus, I also use them as a odds enhancer against what I’m looking at and/or trade set-ups I’m looking to take.
There latest analysis is on the British Pound / Japanese Yen forex pair.
The British pound has initially pulled back during the day on Thursday, breaking down below the ¥132 level, before turning around and reaching towards the 50 day EMA. The 50 day EMA is currently at the ¥132.50 level, an area that of course will attract a certain amount of attention. Because of this, the market should be paid attention to for the next day or so as it could give us a signal as to where we are going next. Longer-term, it’s obvious that we are in a downtrend but a break above the 50 day EMA on a daily close after the jobs figure on Friday could be reason enough to reach towards the ¥135 level.
The alternate scenario of course is a break down below the bottom of the trading session on Thursday, which sends this market down towards the ¥130 level. Ultimately, this is a market that will be sensitive to risk appetite overall, as the Japanese yen is of course the “safest currency” of the G 10. The British pound of course also has the specter of the Brexit situation taking over and, so there is still a lot of weight around the neck when it comes to this pair.
NOTE: in the article they are talking about the US job reports at 8:30 am on Friday. In addition, Brexit is the reason why I haven’t taking many Pound trades in last two months, because it’s such an unknown.
So lets see if their analysis matches up with mine and I will let you assess whether they mirror each other.
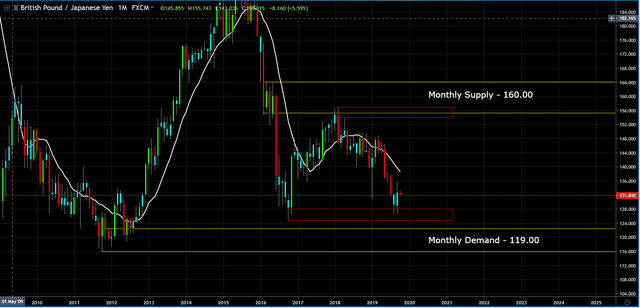
Monthly Chart (Curve Timeframe) – monthly supply is at 160.00 and monthly demand is at 119.00.
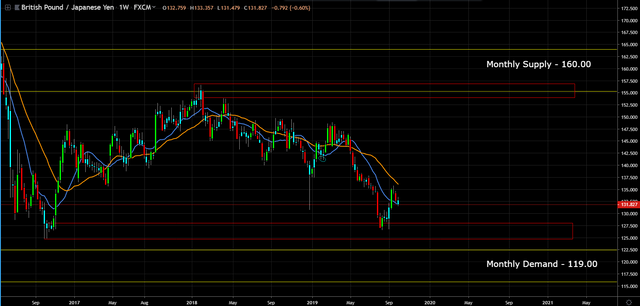
Weekly Chart (Trend Timeframe) – the trend is down.
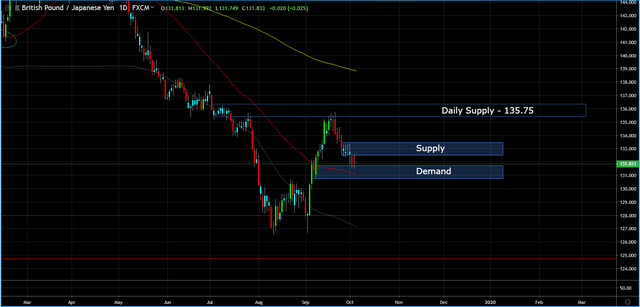
Daily Chart (Entry) – a trade set-up was missed to the downside already. At the moment price is right in the middle of some supply and demand. The chart suggests to keep your finger off the sell/buy button. However, I anticipate things changing after the US announces their jobs report for Sept. in the morning.
This post is my personal opinion. I’m not a financial advisor, this isn't financial advise. Do your own research before making investment decisions.

Thank you for posting from the https://steemleo.com interface 🦁
To listen to the audio version of this article click on the play image.

Brought to you by @tts. If you find it useful please consider upvoting this reply.