Bitcoin stayed in a bearish zone below the 3,500 USD resistance level

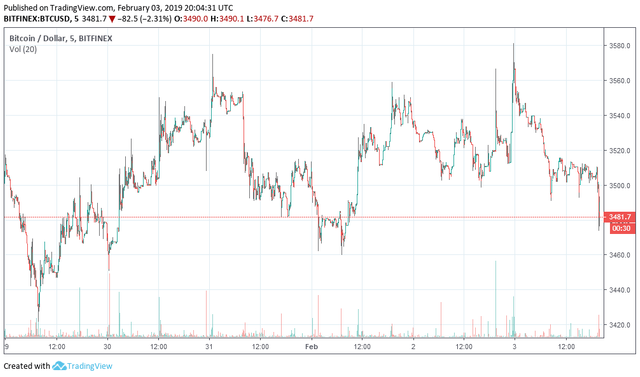
The price of Bitcoin stayed in a bearish zone below the 3,500 USD resistance level. The cryptocurrency tested the maintenance of 3,375 USD a few times and later gave up. Today, the Bitcoin is trading at 3,468 USD with a minimum decrease of less than 0.5%.
Bitcoin has officially entered the longest bearish market of declining prices in its 10-year history.
The world’s oldest and most valuable cryptocurrency achieved an all-time high of 19,764 USD on December 17, 2017, on the CoinDesk Bitcoin Price Index and has printed a series of lower price highs ever since, making February 2 (as per UTC time), the 411th consecutive day prices have been in decline.
As such, Bitcoin’s latest stretch surpasses the duration of the infamous 2013-2015 bitcoin bear market, which spanned 410 days from its price high to low.
Other cryptocurrencies are also slightly in the red with Ripple wiping out 1.3% of its value, while Ethereum decreased by 0.3%. Meanwhile, EOS is rising slightly by 1.64%.
The total market value of the cryptocurrency market is staying at 113.8 billion USD.
Bitcoin technical analysis
Bitcoin moved above the resistance levels of 3,400 USD and 3,420 USD and began a decent recovery.
The price also traded above the 23.6% Fibo adjustment rate at the last drop from 3,673 USD to 3,346 USD. There is a positive price effect, above the resistance level of 3,440 USD.
Moreover, there was a breakthrough over a major shrinking triangle with resistance at 3,440 USD on the 4-hour chart of the Bitcoin price. The price rose above the resistance level of 3,475 USD but remained well below the 100-hour simple moving average (SMA).
Additionally, there was no test of the 50% Fibo adjustment level at the last drop from 3,673 USD to 3,346 USD. The buyers failed to pass through the 3,500 USD resistance zone, which ignited bearish moves.
Initially, the price is traded near the 3,440 USD level, with the support of nearly 3,420 USD and 3,400 USD. If there is a break below 3,400 USD, the price is likely to test the levels of 3,350 USD and 3,320 USD.
Ethereum technical analysis
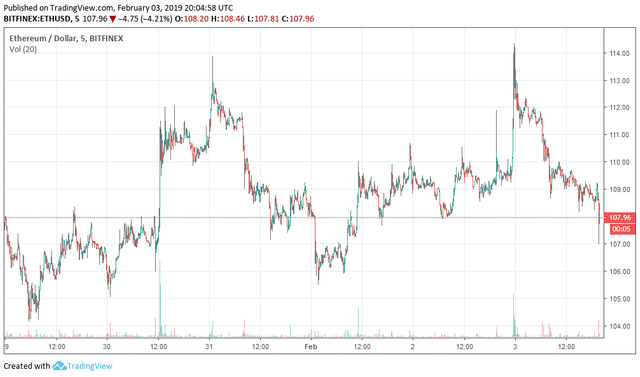
Recently there were several changes in the price of Ethereum above the levels of 102 USD and 104 USD.
Later, the cryptocurrency formed decent support over 104 USD and started an upward movement.
The Ethereum gained above resistance levels of 104 USD and 107 USD. Moreover, there was a breakthrough over 23.6% Fibo adjustment level from the last drop from 117 USD to 101 USD. The price traded with a positive momentum over the key area of 105 USD.
There was a breakthrough over the main bearish trend line with resistance at 107 USD on the 4-hour chart.
The Ethereum tested the resistance range at 109-110 USD, where buyers are located. Moreover, Ethereum also failed near 50% Fibo adjustment level from the last drop from 117 USD to 101 USD. Currently, the price action is positive over 107 USD but Ethereum faces many obstacles close to the resistance levels of 109 USD and 112 USD.
More importantly, the 100-hour simple moving average is also close to the 112 USD level and acts as a solid barrier. Finally, the 61.8% Fibo adjustment level of the last decrease from 117 USD to 101 USD is at 112 USD. Therefore, the price should break the resistance zone 112-114 USD to accelerate upwards.
The Ethereum price has made a nice upward rise above the resistance of 107 USD. However, it is necessary to close over 114 USD for more profits in the near future.
Posted from my blog with SteemPress : http://financeandmarkets.com/bitcoin-stayed-in-a-bearish-zone-below-the-3500-usd-resistance-level/

