Bitcoin-Cash, Litecoin, Digibyte, and Siacoin Correlation Matrix
A couple of days ago, I made a post in which I shared with you my Python code to visualize my/your crypto portfolio (to make it your portfolio, only a couple of small changes are needed). In addition to the portfolio, the code has two other functionalities. First, when running the file "marketLooking.py", it used to run for twelve hours. Every half hour, it extracted information of the coins I was holding from CoinMarketCap.com and stored it in a csv file. Second, when running the file "correlationMatrix.py", it reads all the csv files created and stores the prices of each coin I am holding in a list. Finally these lists are used to create a correlation matrix among the coins. To create the correlation matrices, I used Python's pandas which by default use the Pearson's method.
You might have noticed that when speaking of "marketLooking.py" I used the past tense. That is because I modified it. Now, instead of running an arbitrary twelve hours, when it runs, it asks for input of how many samples you want to take. That way, when I will be on my computer I just approximate how long I will be there and let it running for that amount of time. For example, if I will be working on my computer for two hours, I run the program and input a four. That way it will take four samples, one every half hour and it will take a total of two hours. When I shared my crypto portfolio code for the first time, I only had 24 samples with which I built the correlation matrix. I knew that amount was not enough. That is why I changed the code, so I can collect more samples.
Figure 0. New changes in code.
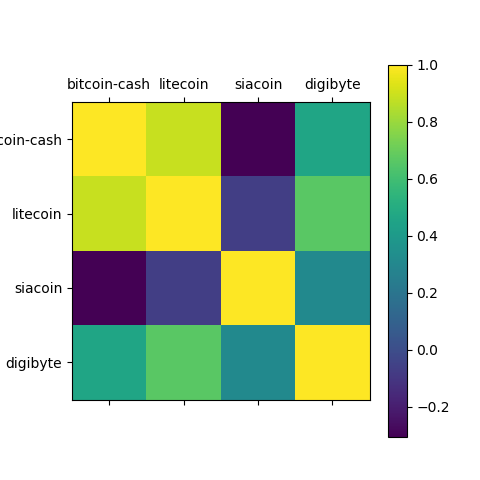
Figure 1. Correlation Matrix with 24 samples.
From Figure 1, you can see that everything seemed severely correlated. Everyone who is in crypto knows that everything seems to be correlated to Bitcoin. If Bitcoin goes down, the whole market goes down. If Bitcoin goes up, the whole market goes up. Therefore, at the beginning I did not find these results that suspicious. Nevertheless, I decided to keep on collecting samples.
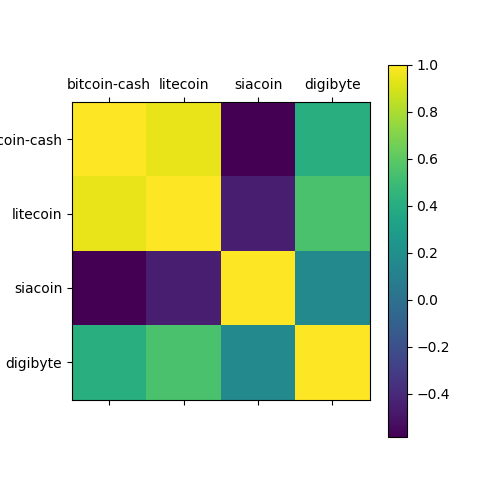
Figure 2. Correlation Matrix with 40 samples.
Compared to the matrix with only 24 samples, we can see several differences. To start with, the range of the correlation indices is wider to the point where we even have a negative correlation between Siacoin and Bitcoin-Cash.

Figure 3. Correlation Matrix with 45 samples.
From Figure 2 to Figure 3 I only added five more samples. Those five samples were not enough to create a change in the matrix. Therefore, I decided to collect more samples every time I graphed the correlation matrix.

Figure 4. Correlation Matrix with 57 samples.
From Figure 4 we can see that the indices range expanded yet a little more going all the way to -.4. In addition, it shows a stronger correlation than before between Litecoin and Bitcoin-Cash.

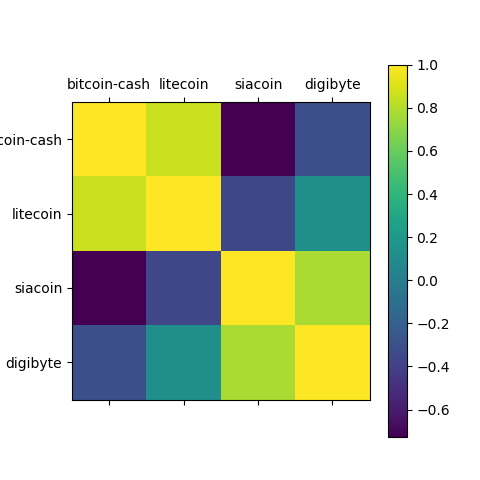
Figure 5. Correlation Matrix with 76 samples.
Figure 5 is the last matrix I have created. From it, we can see that the indices range expanded yet a little more going all the way to -.6. Even though we see some changes in the Digibyte relations, the rest of the matrix has stayed somewhat stable in the last figures. I will continue to collect data and create the matrices, but it seems that we have reached some sort of equilibrium. The changes between figures are not as abrupt as between the first two. Therefore I will not report back here unless I see some real change.
The reason I am computing the correlation matrix of the coins I am holding is because I wanted to see if I am diversifying my portfolio properly. If all the coins were very correlated, then what is the point of diversification? Thankfully, it seems that it diversified enough. From the graph we could say that it is divided into two groups. The groups seem to be weakly or negatively correlated with each other. Nevertheless, the coins in each group seem to be strongly correlated to each other. On one hand, we have Bitcoin-Cash and Litecoin and on the other we have Digibyte and Siacoin.
If you want to compute the correlations in your portfolio, you can use my code. I have pushed to my Github the recent changes I made.
Best,
Be careful my friend. Your analysis is good but ultimately you are diversified within the Crypto sector but still every concentrated in one sector. I made the mistake of have a diversified tech portfolio when the tech bubble burst.
You are completely right. If you are looking for true diversification, you need to invest in several different markets. Nevertheless, this was just meant to analyze my crypto portfolio.
I am sorry to hear that about your investments during the tech bubble. I guess that's how we all learn, though.
You just planted 0.41 tree(s)!
Thanks to @capatazche
We have planted already 7113.53 trees
out of 1,000,000
Let's save and restore Abongphen Highland Forest
in Cameroonian village Kedjom-Keku!
Plant trees with @treeplanter and get paid for it!
My Steem Power = 22172.07
Thanks a lot!
@martin.mikes coordinator of @kedjom-keku
You got a 33.61% upvote from @brupvoter courtesy of @capatazche!