INTRODUCTION TO CARTOGRAPHY - ISARITHMIC MAPPING
How is everything going? Hope you're a having a great time during these summer days. Time to relax and enjoy the simple things in life; our friends and families. I am privileged to live by the sea, so I have been taking advantage of this lately. Everything is great and I felt refreshed, so I thought it's time to share another part of this series with you. But I'm always in a rush, so I don't mean to waste your time. Let's do this!
As promised in a previous Cartography post regarding the techniques and methods followed in order to represent the statistical surface with the utilization of linear symbols, this is the twentieth part of this Introduction to Cartography Series. A milestone I never thought I would reach! This time I would like to take the chance to share general information regarding isarithmic mapping. We will talk about the methods followed and the tools utilized in the projection of 3D surfaces. We will also talk about the two different categories of chracteristic value variables regarding point data, so stay focused!
This is a personal note for those of you who are new to my blog; you should always keep in mind that this is an introductory series about Cartography, which is the art and science of creating accurate 2D depictions of our 3D world. This means that I will be presenting broad information with a pinch of humour, so that nobody gets too bored reading this blog. There's always a high chance of learning a thing or two by reading through this series' episodes, so stay tuned!

Symbolization Problems
As explained multiple times in the previous episodes of this Introduction to Cartography series, the whole process of map symbolization is a rather complicated task that demands the availability of theoretical knowledge related to various different scientific fields. In the last episode of this series I shared broad technical information concerning the symbolization of volumetric data with the utilization of linear symbols. The calculations necessary in order to design the statistical surface for an area of interest with specific dimensions induce the need for the inclusion of all different sorts of spatial information (point, linear, surface). The first two types were the subjects of my last two uploads, which basically means that we are now about to focus on surface data, and therefore talk about the isarithmic method. Bare with me.
All symbolization problems addressed in this blog regarding the calculations necessary for the successful conclusion of the design and construction of the statistical surface, refer to the specific occasion where the existence of volumetric data on a surface of interest of given dimensions has to be represented with the utilization of surface symbols and patterns that are comprised of linear symbols. The creation, utilization, application and appropriate placement of linear symbols and surface symbols that were created with the use of linear elements has always been commonly used by Cartographers in the depiction of volumetric spatial data on surfaces of given location and geometry. This is the hand we were dealt; it is all about making the right use of the available linear elements.
All surface symbols are mainly comprised of linear elements and can easily be perceived as a combination of repetitive linear elements that follow certain rules regarding location, geometry and orientation. All three measurable quantities mentioned are absolutely necessary for the precise description of a geographic entity through the creation of a map. And this is one of the main reasons why specific sorts of symbols refer to certain geometric attributes and represent the frequency of appearance of specific spatial elements. Sets of rules that were developed taking into consideration the way the human sensory system works have been placed in order to make the symbolization of 3D surfaces possible. However it is still a very tough job. Let's see why.

Isarithmic Process
The whole concept of the symbolization process when it comes to the precise representation of 3D surfaces is a rather complicated task. Such a demanding task that the time and effort demanded in order to come up with suitable solutions regarding this issue is much more than what it takes to solve all symbolization problems faced together up until this point. This is a challenge that can thankfully be handled with the utilization of a very useful tool that is known as the Isarithmic Process. The Isarithmic Process is a mathematical tool that is mainly used in two different cases, depending on the spatial characteristics that are studied and measured in each case. Let's take a deeper look at each one of those theoretical situations.
The Isarithmic Process can be a very useful asset when the outter shape of a surface is the main point of interest of a study. Specific geometric attributes are the key variables in this case, which basically means that the volumetric data utilized by Cartographers and Engineers in general refers to certain measurable quantities that are linked to the geometry of our surface of interest. It is also worth noting, even though it should be more than obvious by now, that the dimensions of our area of interest are precisely known. Some of the most significant quantities measured provide Cartographers with information regarding the orientation of our geographic entities and the slope of the natural terrestrial surface.
There is also another theoretical situation in which the uilization of the Isarithmic Process seems to be the key and is commonly embraced by scientists all over the globe. Needless to say, certain geometric attributes are studied and measured in this case as well, defining the whole model that will be utilized for the extraction of metric information in order to reach safe conclusions. In this scenario, the measurable quantities that are linked to the geometry of our surface of study refer to specific spatial characteristics that describe the values of continuous geographic phenomena in particular. This basically means that the phenomena being studied do follow, and therefore can be described by, a continuous statistical distribution.
Types of Isarithmic Mappings
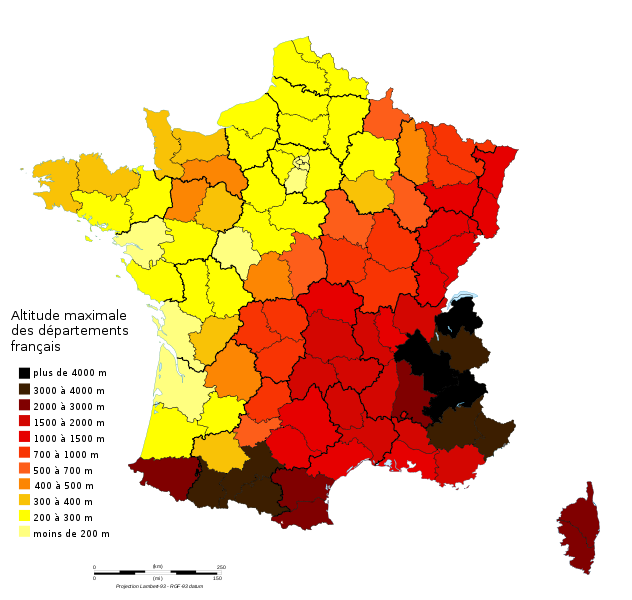
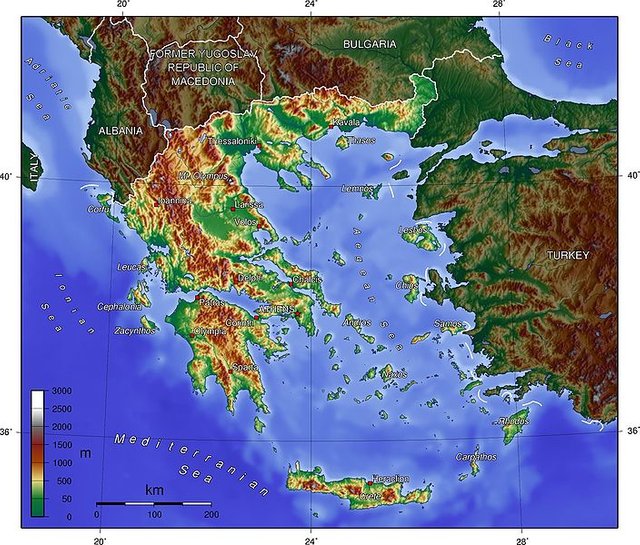
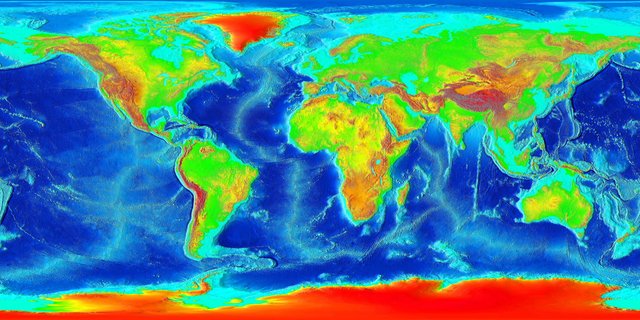
There are two types of characteristic values; the first category refers to variables that are linked with spatial characteristics that can be represented by point symbols. The atmospheric temperature, the altitude of the natural terrestrial surface or the depth of the seabed (distance from the surface) are just a few examples of measurable quantities that refer to specific points on the natural terrestrial surface. High caution is demanded when making measurements regarding quantities that can be represented by point symbols, mainly due to the fact that even the slightest error could potentially affect the validity of our measurements. Needless to say, this would affect our calculations in return, and therefore downgrade the quality of the end product.
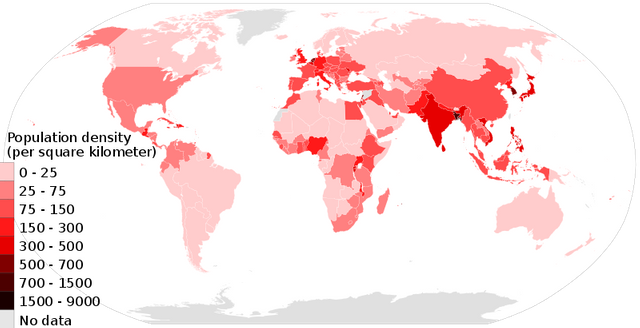
There are significant differences in relation to the previous category of characteristic values, when dealing with characteristic values that do not refer to specific points in space (or on the natural terrestrial surface), and therefore cannot be represented with the utilization of point symbols. Human population per square kilometer, percentage of agricultural surfaces per square kilometer, and ratio of specific kinds of agricultural products per square kilometer are just a few examples of measurable quantities that refer to surfaces of given dimensions on the natural terrestrial surface. In this case, instead of the exact 3D location of an entity, Cartographers utilize and measure surface units. Obviously, the final calculations are highly affected by the precision regarding the observations made. No precision means no quality; Engineers appreciate precision. Thanks for your time!
Alright eveyrone, that's all for today, thank you for the attention. We have now reached the end of this milestone part of my beloved Introduction to Cartography series. Looks like there is a long way to go, even though I never thought I'd reach this point. Please bare with me and sit tight, there is a lot more to learn as we move forward. Make sure to let me know in the comments below if there are any questions regarding my work. More Engineering stuff regarding Cartography and Geology coming out within the next days, so stay tuned and follow me for more!
PREVIOUS PARTS OF THE SERIES:

IMAGE SOURCES:
REFERENCES:
University Textbooks & Course Lectures:
Χαρτογραφία Ι/ Cartography I -TSOULOS(National Technical University of Athens, School of Rural & Surveying Engineering, Course Lecture Notes)
Χαρτογραφία ΙΙ/ Cartography II - NAKOS(National Technical University of Athens, School of Rural & Surveying Engineering, Course Lecture Notes)
Internet Links:
http://www.geog.ucsb.edu/~kclarke/Geography183/Lecture11.pdf
https://help.rockware.com/rockworks17/WebHelp/maps_2d_symbols.htm
https://prism.ucalgary.ca/bitstream/handle/1880/45758/2001-693-16.pdf?sequence=2&isAllowed=y
Hello dear @lordneroo :)
Thank you for introducing us to the fascinating (and complex) world of maps. Isarithmic Process is something I have never heard of before even though in social psychology we are presented with maps such as the population one you shared here. Because of the information you share here with us I have become not only more interested in maps, but I also have acquired a whole new level of appreciation for them :)
Hello my dearest @abigail-dantes, I sincerely hope you're having a wonderful time during these summer days!
I am more than grateful and honored that you took the time to read my work (again) and leave a thoughtful and kind response. I'm very happy you find my work interesting and that you can spot links between our two (quite different) scientific fields. Comments like the one you just left always make my day and I'm thankful for that :)
Looking forward to reading your next blog, I always learn a lot from your work.
Have a wonderful day! :)
This post has been voted on by the steemstem curation team and voting trail.
There is more to SteemSTEM than just writing posts, check here for some more tips on being a community member. You can also join our discord here to get to know the rest of the community!
Thank you so much for all the support!
You are always welcome to join us and get more recognition for your posts. You can find more information about geopolis here or join our Discord server.
Thanks for the encouragement!
I had never heard of the term isarithmic either. It's a nice series you are having here! As a beginning geographer I find them very useful. You might want to check out @geopolis. it is a community revolving around earth sciences and I think you might find it interesting :D
Thanks for reading and leaving a kind response. I will check out @geopolis, thank you for the info!
Have a good day!
Καλημέρα Δημήτρη, υπέροχο όπος πάντα!!! :))
διακοπές φέτος πήγες, θα παε???
Γεια σου Νικ! Ευχαριστώ πολύ για την στήριξη!
Πήγα, πάω, θα ξαναπάω... όλα μαζί! Εσύ; Πού θα την πας την οικογένεια;;
Μυτιλήνη θα πάμε το Σάββατο που έρχεται... Εσύ που πήγες και που θα πας;;
Interesting article! :) Check out @atimk23 and don’t hesitate to follow and upvote. 🙃
Thanks! Have a good day!
Thank you too! Have a great time today! 🙃🙃
Congratulations! This post has been upvoted from the communal account, @minnowsupport, by lordneroo from the Minnow Support Project. It's a witness project run by aggroed, ausbitbank, teamsteem, someguy123, neoxian, followbtcnews, and netuoso. The goal is to help Steemit grow by supporting Minnows. Please find us at the Peace, Abundance, and Liberty Network (PALnet) Discord Channel. It's a completely public and open space to all members of the Steemit community who voluntarily choose to be there.
If you would like to delegate to the Minnow Support Project you can do so by clicking on the following links: 50SP, 100SP, 250SP, 500SP, 1000SP, 5000SP.
Be sure to leave at least 50SP undelegated on your account.
This must be an inside job.
Congratulations @lordneroo! You have completed the following achievement on Steemit and have been rewarded with new badge(s) :
Click on the badge to view your Board of Honor.
If you no longer want to receive notifications, reply to this comment with the word
STOPI always achieve stuff. :P
Congratulations! Your post has been selected as a daily Steemit truffle! It is listed on rank 13 of all contributions awarded today. You can find the TOP DAILY TRUFFLE PICKS HERE.
I upvoted your contribution because to my mind your post is at least 11 SBD worth and should receive 160 votes. It's now up to the lovely Steemit community to make this come true.
I am
TrufflePig, an Artificial Intelligence Bot that helps minnows and content curators using Machine Learning. If you are curious how I select content, you can find an explanation here!Have a nice day and sincerely yours,

TrufflePigYou are such a good bot!