Photovoltaic Cell Modelling: A tool for Accurate Photovoltaic System Design
As the world has seemed to be more concerned about energy use, the use of photovoltaic cells in harnessing the renewable source of energy production has increased over the years and has keep on growing owing to decrease in their manufacturer cost and likewise, the substantial increase in research and development work in the field of photovoltaic system has made photovoltaic system a fast growing way of harnessing renewable energy sources for power generation.
The abundant nature of solar energy, increasing efficiency of solar cells and as interest is geared towards Pollution and global warming, has made the use of photovoltaic cells a leading technology in the renewable energy world.
Solar Energy is certainly one of the most promising renewable energy sources because of its versatility and friendly nature. The evolution of this energy source has kept on providing solutions to energy resources problems but it also has to be fully harnessed to make the best use the resources. There are different environmental and geographical factors that affect these resources. However, the measurement of solar resources under these factors make system cost effective and enhance usage rate of renewable solar energy.
Photovoltaic cells are made up of silicon crystals which generates direct current when struck by solar irradiance (photons), the effect which is popularly known as the photoelectric effect. It was Alexandre Edmond Becquerel that first discovered the photoelectric effect when he found out that some amount of electric current could be produced by certain materials on exposure to ray of light. Later, Albert Einstein gave a description of the phenomenon which has now become the basic principle of photovoltaic operation.
Photovoltaic modules are of different types which are the crystalline and the amorphous technology. The crystalline technology are the monocrystalline and the polycrystalline while the amorphous type is of the thin film technology. The crystalline technology are found with the best technology delivering greater efficiency and higher durability compared to the amorphous technology.
Generally, when Photovoltaic cells operates, they have their electrical output varying with ambient environmental conditions which are mainly the temperature and the solar irradiance. However, load connected to a photovoltaic system should ideally be operated at a maximum power point of the Photovoltaic system.
Getting the maximum power point of photovoltaic cells operation, the characteristics behaviour are studied under wide range of environmental conditions. Efforts have been made to study the behaviour of photovoltaic system under different working condition but one of the easiest ways developed by researchers is by the mathematical and electrical based model which describes the Current-Voltage relationship of the photovoltaic circuit.
Photovoltaic modelling provides an easy way of predicting and understanding the effect of environmental changes on photovoltaic cell output. It provides the ways to understand the current, voltage and power relationships of Photovoltaic module. Photovoltaic modelling just not help in performance study analysis of a solar based power system but helps in having a perfect guide to better system design.
Modelling of Photovoltaic cell
A simple representation of the characteristic of a solar cell is given by the electrical equivalent circuit representing the model. The structure of the solar cell is similar to that of a photodiode with silicon crystals absorbing photons, thereby making representation of a typical photovoltaic cell with a circuit consisting a series resistance with diode in parallel with a shunt resistance and the mathematical description of the cell being derived from the physics of P-N Semiconductor junction.
Photovoltaic cell is basically a P-N junction in a thin layer of semiconductors converting converting solar irradiance to electricity through photoelectric effect. The modelling of Photovoltaic cells gives a description of the cell behaviour and predicting the energy production of photovoltaic cell. Several types of electrical model of Photovoltaic cell are employed which are classified based on number of diodes. The single diode diode and the double diode model are commonly employed.
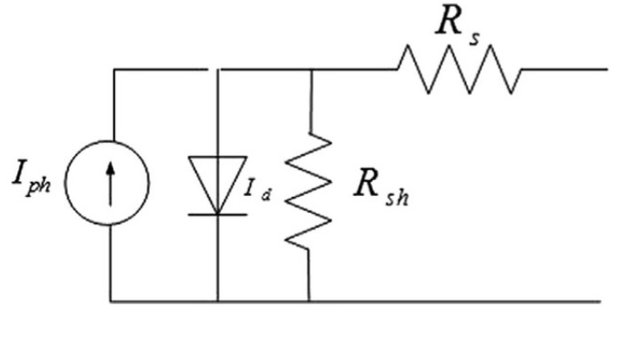
Single Diode Model. image created by me @olajidekehinde
The single diode model is a simpler model widely used as it gives a good accuracy with less task. As described by the figure above, it consist of a current source Iph which represents the photocurrent which varies linearly with the solar irradiance, parallel to a diode and series resistance Rs and shunt resistance Rsh of the cell.
The mathematical equation that expresses the photovoltaic cell is given as:
Ipv = Iph - Id - Vd/Rsh
)
Double Diode Model. Image created by me @olajidekehinde
The figure beside describes the behaviour of solar cell through a two diode model. The electrical circuit consists of two parallel diodes Id1 & Id2, a photocurrent Iph , a shunt resistor Rsh and a series resistor Rs. The mathematical expression for this model is given as:
Ipv = Iph - Id1 - Id2 - Vd/Rsh
These two circuits can be used either as an individual cell or a module which is the series and parallel combination of cells or an array consisting of several modules. Generally, the two diode model is found to be more accurate as compared to the one diode model but requires a deal of much number of parameters which increases the complexity and computational effort. Due to this reason, one diode model is more preferable than the two diode model because of its simplicity.
Why not be more relaxed and allow me to lead you through an experiment which studies the effect of Temperature and Irradiance on Photovoltaic System by the use of a single diode model as a case study. By so doing, a performance study will be carried out on a photovoltaic system under a wide range of environmental conditions and a single diode model belonging to this experimental setup will be developed and simulated, then will hereby validate this model using the measurements taken from the experimental setup. Like I said earlier, modelling of a photovoltaic system provides an easy way of predicting and understanding the effect of environmental changes on photovoltaic cell output. Here we go...
The experimental setup consist of 100W each, connected in chains of two series modules to make a 24volts system and the equivalent current rating value. The nominal (standard) test condition of the photovoltaic modules are given as:
Irradiance (Gn) =1000W/m2
Temperature (Tn) = 25˚C
Spectrum = AM 1.5
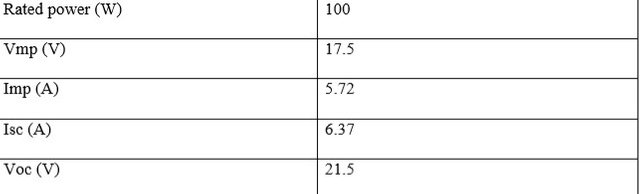
Electrical Characteristics of the Photovoltaic Module. Image created by me @olajidekehinde
and the electrical characteristics of the module are given as show in the figure above.

The real time measurement of the photovoltaic system was taken under range of environmental conditions. Data (Voltage, current and temperature) was acquired from the photovoltaic array using ML2440 Maximum Power point tracking (MPPT) solar charge controller. The data are being logged to a computer system as they vary with time.
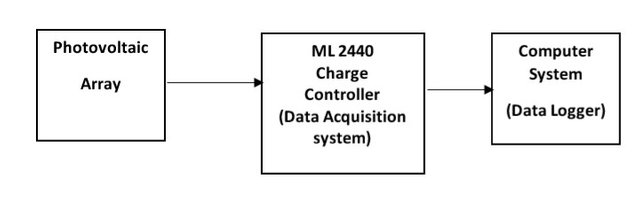
Block Diagram of experimental Setup. Image created by me @olajidekehinde
Also, the meteorological data for the period of the performance monitoring of the photovoltaic array is being collected for the irradiance value. The test consist of one-day data recording comprising of temperature, irradiance, voltage and current taken from 9am – 4pm as shown below.

Basically, the most important points used in describing the cell electrical performance are the short circuit current Isc where the current is maximum, the open circuit voltage where voltage is at maximum and the maximum power point where the product of current and voltage is maximum.
The voltage and current characteristic equation of a solar cell using a single diode model is derived as;
Iph = Isc + Ki(T-298) * Ir/1000
Where;
Iph = photo-current,
Isc = short-circuit current,
Ki given as the cell short circuit current temperature coefficient.
Ir = solar irradiation.
The Overall output current of Photovoltaic module is thereby given as:
Ipv = Np * Iph - Id - Ish
Where Np, Id , Ish have their respective calculated values.
Based on the equations of the single diode model described , a model of the solar module is developed and programmed in MATLAB Script environment using the data from the photovoltaic module manufacturer's data sheet. Having done this, the current-voltage (I-V) curve and power-voltage (P-V) curve output characteristic of the model and experimental setup will be plotted and the model will be compared with the experimental setup on the validity of the model.
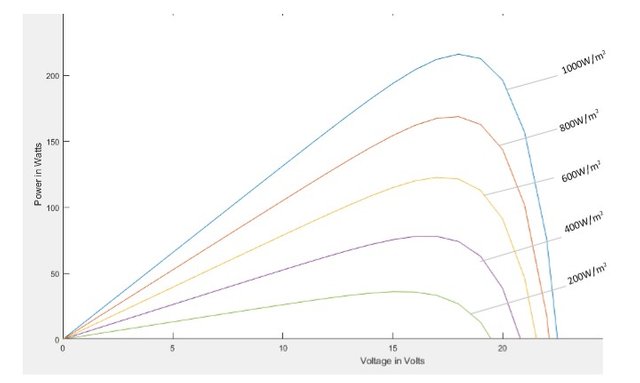
The figures below illustrates the Photovoltaic cell model current-voltage (I-V) curve and power-voltage (P-V) curves when simulated at irradiance and temperature at 1000(W/m2) and (25˚C) respectively (STC).
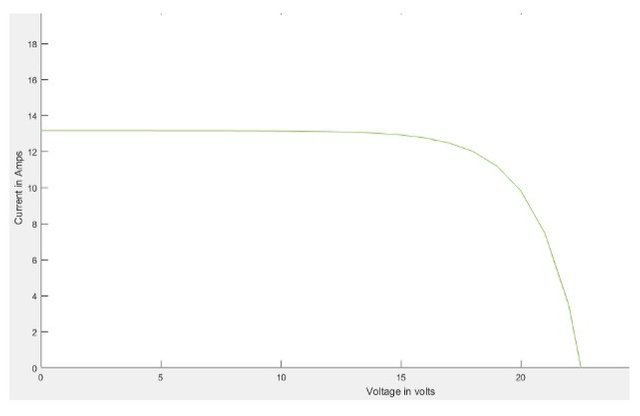
I-V Plot at STC. Image created by me @olajidekehinde
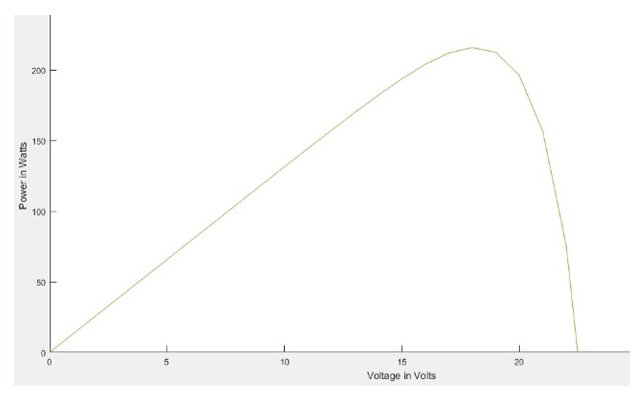
P-V Plot at STC. Image created by me @olajidekehinde
At standard test condition (STC), the photovoltaic cell performs at maximum power due to high voltage and corresponding high current i.e. deducing from the I-V plot, the voltage value at 18 gives maximum current value of 11.81. At this point, the product of voltage and current is at its maximum from the I-V curve.
Similarly, the P-V curve shows the maximum power at standard test condition (STC). The STC relationship between the power and voltage at maximum was as a result of high current output characteristics at STC.
Moving on from the standard test condition, Simulation of Photovoltaic array model was conducted for different temperature condition varying from 25˚C - 45˚C at an interval of 5˚C keeping irradiance constant at 1000 W/m2 and also for different irradiance condition varying from 2000 W/m2 - 1000 W/m2 at a constant temperature of 25˚C. This is to show the effect of changing temperature on Photovoltaic output.
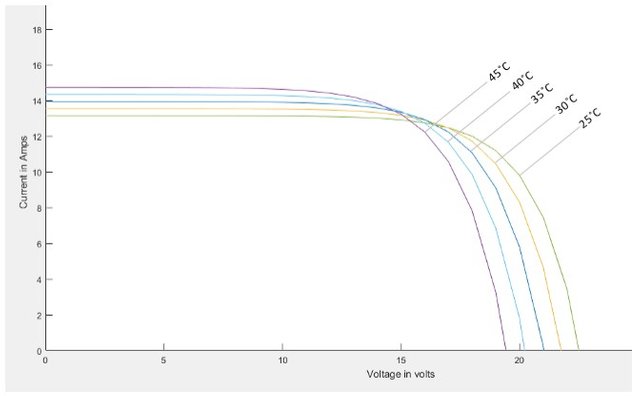
I-V Curve at varying temperature. Image created by me @olajidekehinde
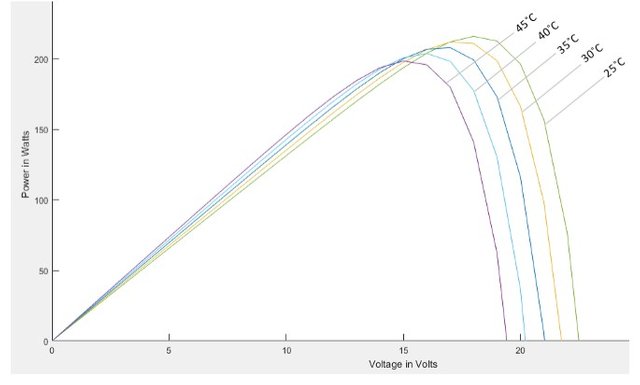
P-V Curve at varying temperature. Image created by me @olajidekehinde
As we have it from the simulation results, with varying temperature and constant irradiance, it can be observed in the I-V curve that when the operating temperature increases, the output current dramatically increases while output voltage decreases which results in a net reduction in power with a rise in temperature as shown in the P-V curve above.
In the same vein, keeping temperature constant with values of irradiance being varied, we can as well determine the effects of change in irradiance on the photovoltaic output
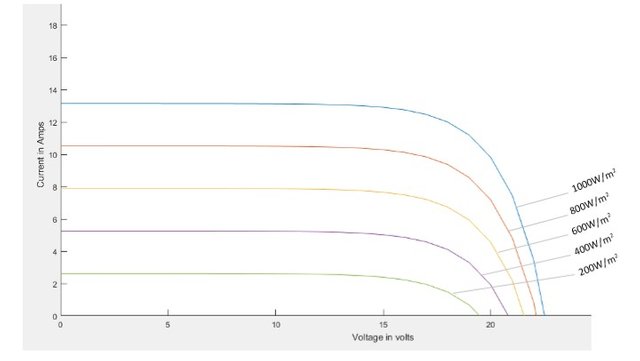
I-V Curve at varying Irradiance. Image created by me @olajidekehinde
P-V Curve at varying Irradiance. Image created by me @olajidekehinde
As observed, when the irradiance increases, the output current and voltage also increases as shown in the I-V curve above. This result in the P-V curve also shows the net increase in power output with irradiance at constant temperature.
These model simulations reveals how Photovoltaic module, firstly behaves under Standard Test condition and how the I-V curve & P-V curve characteristics of solar modules changes as the ambient environmental condition changes and proving the dependence of the Photovoltaic module output characteristics on changing environmental condition.
Moving on, the results obtained by these simulations will be validated using measurements from the experimental setup of the Photovoltaic module to develop the current-voltage (I-V) curve and power-voltage (P-V) plot which will be compared.
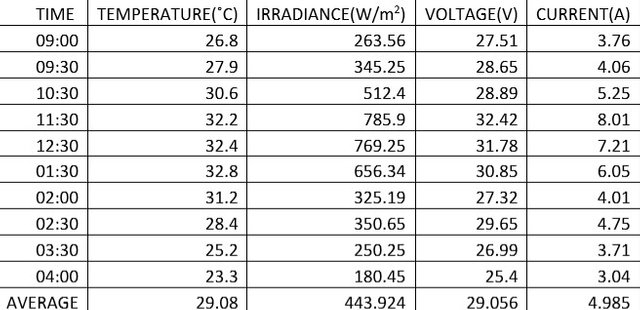
Measurements from experimental Setup. Image created by me @olajidekehinde
From the experimental data, the current-voltage (I-V) curve and power-voltage (P-V) curve are plotted at different values of irradiance and corresponding values of Temperature.
The plots below shows the variation of module output current and output power at different values of irradiance and corresponding temperature from test taken from experimental setup of the Photovoltaic module.
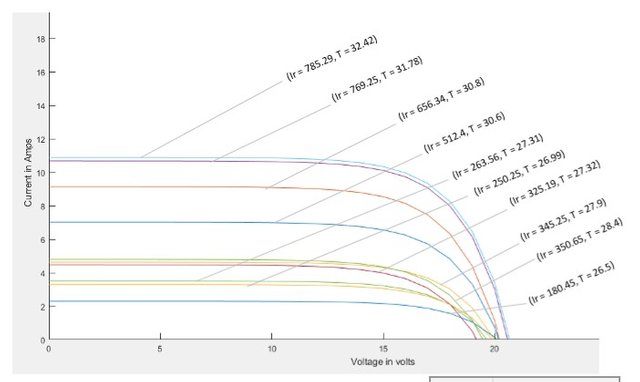
I-V curve at different values of irradiance and corresponding temperature . Image created by me @olajidekehinde
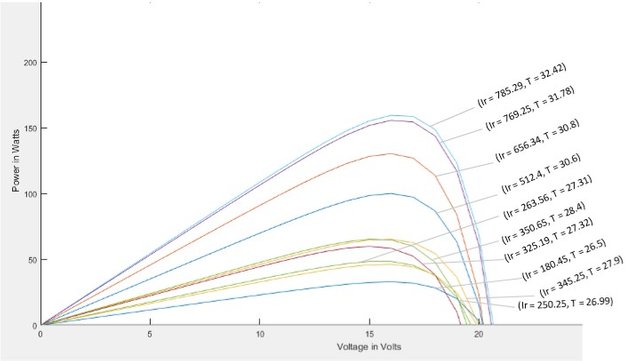
P-V curve at different values of irradiance and corresponding temperature . Image created by me @olajidekehinde
It can be observed from the I-V curve that the current increases in proportion with solar irradiation. Similarly, the open circuit voltage also increases as solar irradiance increasing leading to an increase in output power which is also shown with the P-V curve and while operating temperature increases, the output current increases and the output voltage marginally decreases resulting in a net reduction in power output with a rise in operating temperature.
A recap on the simulations done shows that at Standard Test Condition (STC) , the PV cell performed at maximum power due to high voltage and corresponding current which ascertain the fact that power is at maximum point at standard test condition of irradiance and temperature at 1000(W/m2) and 25˚C respectively.
Similarly, simulation of the model was conducted for different temperature conditions keeping irradiance constant at 1000(W/m2) and also for different irradiance and constant temperature of 25˚C and was observed that the I-V curve output current dramatically increases while output voltage decreases as temperature increases at varying temperature and constant irradiance which result in a net reduction on the PV curve as temperature increases.
Also, as the irradiance increases at constant temperature, the output current and voltage increases on the I-V curve. The P-V curve indicates a net increase in power output with increase in irradiance at constant temperature.
The result obtained by the model simulation were validated using data from the experimental setup of the Photovoltaic module. The experimental setup results from the I-V and P-V curves shows similar pattern in comparison with the results of the model simulations at standard test condition (STC) and at varying temperature and irradiance.
These results thereby, shows and ascertain that the single diode model can be an accurate tool for the prediction of energy production.
CONCLUSION
Modelling of Photovoltaic system is a reliable tool which designers of photovoltaic system makes use of in predicting energy production of a photovoltaic system under any set of operating conditions in order to make decision on better Photovoltaic design. It is as well important as an individual or expert in solar works to get familiar with the science behind the operation of Photovoltaic modules.
Perfect modelling does a great deal in estimating performance of Photovoltaic modules in different environmental conditions. This article has shown the dependence of photovoltaic performance on variation of environmental condition and a concise understanding of the current-voltage (I-V) curve and power-voltage (P-V) characteristics of a module which serves as the model for researchers in the field of Photovoltaic modelling. I hope it's worth the time reading. Thanks for stopping by, till I come your way again with another fascinating article in the world of renewable energy. Do have a great week ahead!
REFERENCES
Pinto, C. S. (2016) Review and validation of models for photovoltaic array performance. Instituto Superior Technico, Lisba, Abril.
Mikel, S., Sindia, C., & Monica, A. (2013) Adjustment and validation of a 25KW photovoltaic system Matlab/Simulink model, International Journal of Renewable Energy Research.
Hasan, M. A. and Parida, S. K. (2016). An overview of solar photovoltaic panel modelling based on analytical and experiment viewpoint. Renewable and Sustainable Energy Reviews
Nguyen, X. H. (2015) Matlab/Simulink based modelling to study the effect of partial shadow on solar photovoltaic array.
King, D. L. (2000) Sandias PV module electrical performance model. Sandia’s national laboratories, Albequerque, New Mexico.
Moufdi, H. & Bendida, M. (2012) Comparison and statistical validation of a model of photovoltaic module, International Journal of Energy
If you write STEM (Science, Technology, Engineering, and Mathematics) related posts, consider joining #steemSTEM on steemit chat or discord here. If you are from Nigeria, you may want to include the #stemng tag in your post. You can visit this blog by @stemng for more details. 
I'm a proud member of @promo-mentors where you get mentored and guided on how to make quality posts on steemit amongst other benefits. Do join us on discord. We anticipate your arrival.

Conditions such as temperature affect the performance of PV cells. That is one of the reasons some people install the panels to have some space between it and the roof. That way, there would be movement 9f air below the panel to cool it.
The use of MPPT charge controllers have helped users to harness the highest amount of energy from the PV panel at any time and from what i know, it has been proven to perform well.
Finally, i read that there are modifications going on to further increase the performance of PV cells, one of which is the use of nanotechnology.
A nice write up i must say.
Such a great contribution, boss. Wanna be like you when I grow up o.
Hello! I find your post valuable for the wafrica community! Thanks for the great post! @wafrica is now following you! ALWAYs follow @wafrica and use the wafrica tag!
Solid article, sir. Understanding the modeling process of photovoltaic modules is definitely a step forward in design and improvement of more improved sources of renewable energy for our planet. Great work!
💪
This post has been voted on by the steemstem curation team and voting trail.
There is more to SteemSTEM than just writing posts, check here for some more tips on being a community member. You can also join our discord here to get to know the rest of the community!
Hi @olajidekehinde!
Your post was upvoted by utopian.io in cooperation with steemstem - supporting knowledge, innovation and technological advancement on the Steem Blockchain.
Contribute to Open Source with utopian.io
Learn how to contribute on our website and join the new open source economy.
Want to chat? Join the Utopian Community on Discord https://discord.gg/h52nFrV
This is a great contribution I must say. Power is life. It gives life to every other devices. Solar energy is the future.
I am @teekingtv and I write STEM.