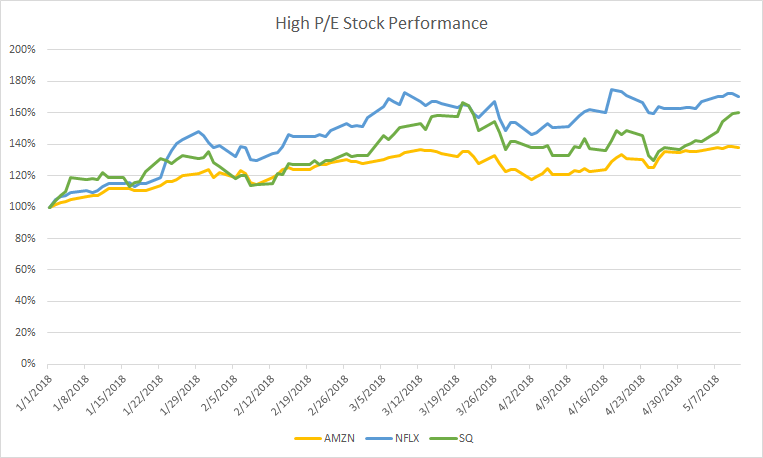
High PE Stock YTD Performance (AMZN, NFLX, & SQ)
Index - https://steemit.com/tax/@alhofmeister/3ibscz-accounting-and-finance-blog-index
Introduction
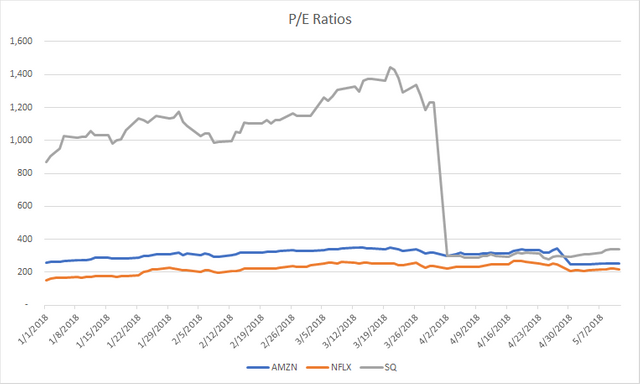
In this post, I wanted to present two graphs. The first graph shows the price to earnings ratio for companies that have high P/E ratios. Note that the earnings is calculated on historical data, so the high P/E ratio for Square (SQ) represents the increase in earnings since the last reported period. The second graph shows the year to date performance of each of the 3 companies (current market cap / market cap as of January 1). As demonstrated by the second graph, each of these stocks have performed very well since the beginning of the year. In a second post, I examine the performance of stocks with a low P/E ratio.
P/E Ratio
YTD Performance
References
https://www.zacks.com/stock/chart/AMZN/fundamental/market-cap
https://www.zacks.com/stock/chart/NFLX/fundamental/market-cap
https://www.zacks.com/stock/chart/SQ/fundamental/market-cap
https://www.zacks.com/stock/chart/AMZN/fundamental/pe-ratio-ttm
https://www.zacks.com/stock/chart/NFLX/fundamental/pe-ratio-ttm
https://www.zacks.com/stock/chart/SQ/fundamental/pe-ratio-ttm
@contentvoter
beautiful post