BTC Point and Figure and Discussion on Recent 4 Hour Bull Div
Point and Figure 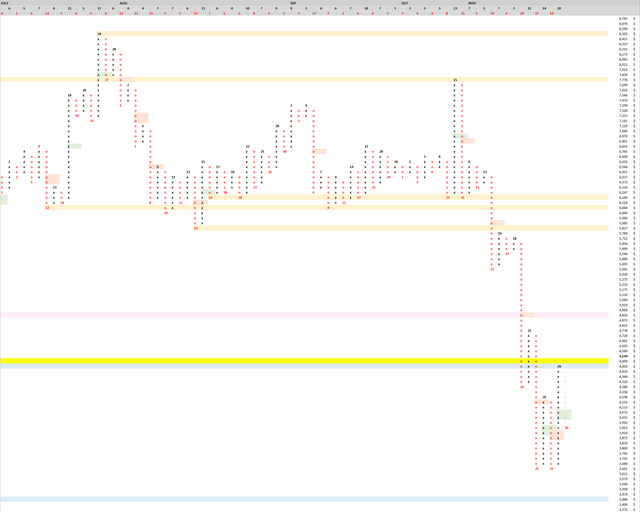 When the daily closes in 10 hours we will have a new column of 12 O's. This will resolve 50% of yesterday's long column of 20 X's. Resistance was found at an old horizontal level around 4,454 confirming that horizontal level is still in play. Our range is now between 3,651 and 4,454.
Here are the recent long pole of O's, during the crash down from the big wedge, which have not resolved 50%: 9/31/2018: 23 O's, resolves if price moves above $6,901. 9/15/2018: 19 O's, resolves if price moves above $5,885. 9/20/2018: 29 O's, resolves if price moves above $4,920. It could be a while before we see all 3 resolved, but I would be cautious shorting until at least the third is resolved with a price move above $4,920.
4 Hour Bull Div posted yesterday played out nicely 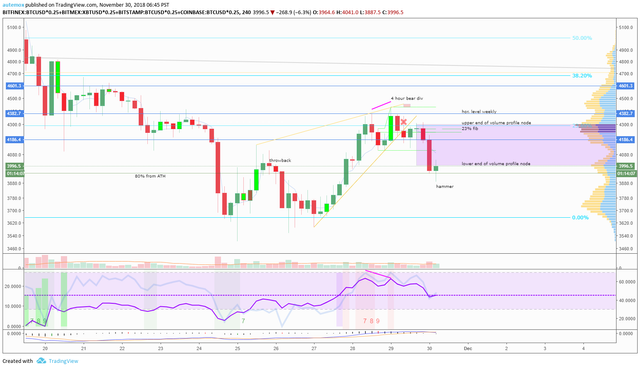 It is no longer in play. Looking at how we are at lower end of volume node, 80% from ATH, and current 4 hour looks like it will be a hammer (1 hour to confirm), this will be a good place to close a short. Although tempting given downtrend on longer timeframes, I would avoid letting a short on this timeframe ride. With so many unresolved columns of O's, and no real bounce (just deadcats), there is too much risk of upside. Instead watch the price as it stays in this range and wait for good entry that you can manage risk on.