Ethereum Technical Analysis for Swing Traders
Conclusion for today’s Ethereum price analysis: 168.40 is critical for the price of Ethereum and a breakout above the price level implies resumption of bullish momentum.
Ethereum analysis for today is carried out on the 6 hour timeframe using a logarithmic scale, with chart inspection provided from September 12, 2018 to current date.
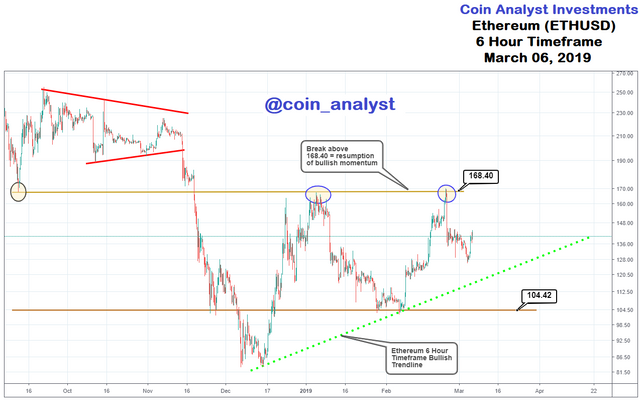
A range bound price movement is identified for Ethereum and drawn on the chart between 168.40 and 104.42. Of particular importance is the former price level (i.e. 168.40) as it was previously a support level for Ethereum back in September of 2018.
Same support price level presented resistance for price action in the week of January 02, 2019, and also again on January 24, 2019 as highlighted by the blue ellipses. The implication of the above is that the upper boundary of the range movement indicates a change in polarity and/or significance of the price level for Ethereum going forward.
Current bullish trend on the 6 hour timeframe chart from a price low of 84.00 on December 15, 2018 is also important to pay attention to as price breaking below improves the likelihood of testing the bottom of the price range at 104.42.
Retracement of price to 104.42 and consolidation that is confirmed by momentum presents a buying (long) opportunity in Ethereum. This strategy is considered less conservative than if price attempts a breakout above 168.40.
Interested in the Litecoin Analysis (XAUUSD)? Check out our previous analysis below:
https://coinanalyst.investments/2019/02/26/litecoin-analysis-5/