Journey to CFD crypto trading - Episode 009 - Setting up Ichimoku Cloud Trading
I have came about three weeks from initial testing stage. In between, I have blown some demo due to wrong lot size. Also, idiotic way of trading the wrong stuff, like BTC and BTS has a huge difference interms of required margin, and I managed to screwed them up. I understand there's no excuse, but having being a newbie in crypto dealing, this demo is exactly vital to success or else I will be blowing real money for no reason. Idiotic thing like this will happen when one not familiar with the financial instrument traded.
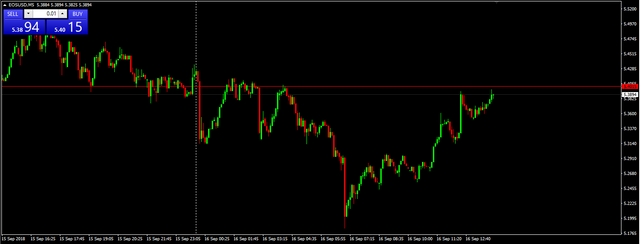
This is an EOS chart I captured from JAFX broker demo platform. Trust me if anyone have followed my work, they'll realized 9 out of 10 of my trades, I'm referring to EOS. Not that I particularly like the technical or application of this crypto, it simply because I like the behaviour of this crypto. How it moves and how its being traded. Take a look at the above screenshot again, when volume come, it move by a SECTION and consolidate. Which makes it very predictable in my opinion. I have recently decided to include a TRENDING indicator to help with my trading, which is Ichimoku Kinko Kyo.
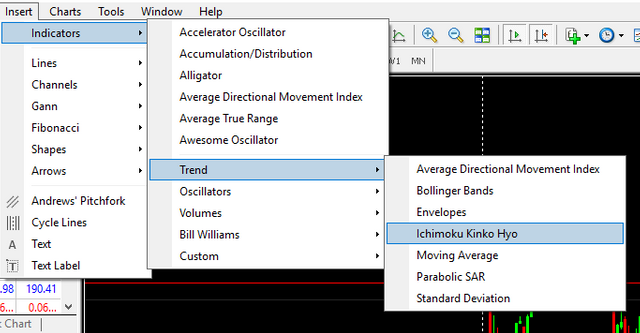
Indicator came preloaded inside the MT4 platform, so it is very convenient to be added on to the chart by selecting Inser/Trend and ther I found the Icimoku.
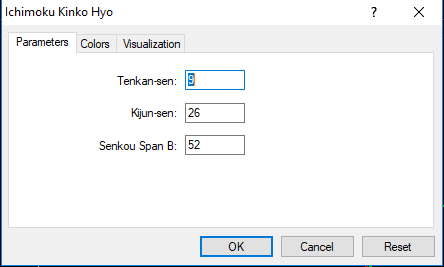
And then the indicator window popped up. Standard settings as below:
- Tenkan-sen : 9
- Kijun-sen : 26
- Senkou Span B : 52
Speaking of the numbers, don't you find it funny like most of the indicators despite from different financial background they were created, but somehow their numbers are the few 9, 12, 26, 52, 144, 233 etc. Take note this is the first time I use YOU in my trading diary. Feel free to correct me if I'm wrong. I have absolutely no idea how they ended up with the similar number, but I do suspect due to the popularity of these number, as a result whenever price action reaches these averaging numbers, technical analysis will see some reaction from the market because everybody is reacting at the same time. Am I making any sense? Let's forget about it. If anyone ask me why don't I change the settings? I would say, those settings are there for a reason. If I'm so smart, I could have create my own indicator, why would I still be struggling to learn another indicator from other people.
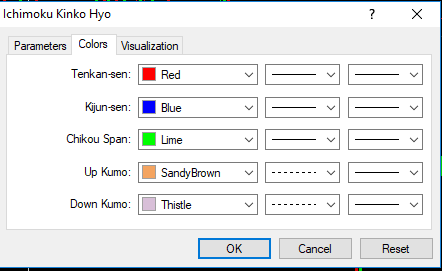
Switching the tab to COLORS, I can select the color I want to display on my chart. Since I'm going to dig into the CLOUD(KUMO) trading, in future I will make a robot that trades with the KUMO, shall I call it KUMO TRADER? So now I'm going to hike the rest of the lines and leave only the KUMO on my chart.
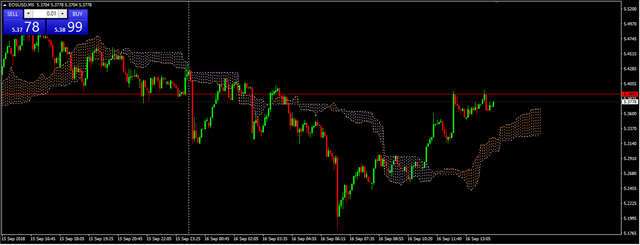
Here, the chart has been properly setup. In general, these KUMO gave me big picture of where the market will head to. In general, price above UP KUMO means trending UP, vice versa for DOWN KUMO. On visual inspection, anytime getting in when price avoce UP KUMO has been very profitable! And since this is CFD, doesn't matter if I'm trading STOCK, Currency or even Crypto, I'm trading on a CONTRACT. Hence there's no difference if I have the REAL thing in my hand for me to sell. I can create a contract, sell first and buy back later at lower price to earn the difference. Which in trading term, it's called SHORT SELL.
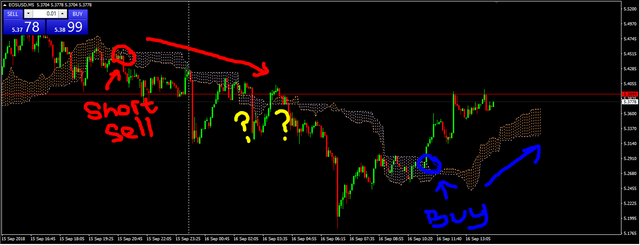
Here is another graph I manage to spoil. I have highlighted the possible entries. The left side red SHORT SELL could be very profitable! The only problem is, these are still charts, it brings absolutely nothing I totally understand. When trading live, will be antire different story! Hence in the middle I have added two yellow question marks. That is exactly what happened when price going back above the cloud, should I buy? I'll be answer that later on my next post. I'm about to wrap this session up, let's move on to the right side with blud color pen, marked a very nice entry for buy, would be very profitable! Yes, again I understand someone would have say I'm merely curve fitting the trading condition. But this one by eyesight, it does look promising and easy enough to make robot. So I am going to use this as a foundation to make a base for a trading robot. Next up, I will add in more filter to make it more accurate.
I would like to thank all my friends and family who has been supporting me. Feel free to leave me feedback by clicking below yellow banner. > 谢谢大家一直以来的支持和对我疼爱有加。如果方便,请你点击下图到我的个人资料网页为我留言请我吃星星哈。

 CREATE YOUR OWN @REVIEWME PROFILE TO START EARNING CREDIBILITY STARS FROM THE COMMUNITY!
CREATING YOUR PROFILE IS EASY! JUST FOLLOW THE STEPS HERE ☜(ˆ▿ˆc)o
你那里天气如何?请支持中文区的见证人, @abit @bobdos @ety001 @justyy @skenan (首字母顺序),全投,一个都不要漏。如果不想再收到我的留言,请回复“取消”。
加了。投了三个。
Posted using Partiko Android
KUMO令我想起了一種看很長趨勢的指標叫濟安線🤔
Posted using Partiko iOS
下次自己写一个指标😃
Posted using Partiko Android