Bullish Candlestick Patterns for better trading accuracy
Candlesticks form and earlier using 18th century during rice trading in Japan. Credit goes for candlestick pattern to Munehisa Homma (1724–1803) who traded rice using candlestick. Candlesticks are true reflectors of a market. It will help you in a prediction of the market.
There are dozens of Bullish reversal. But we are discussing here most popular patterns which are widely used by many market analyst.
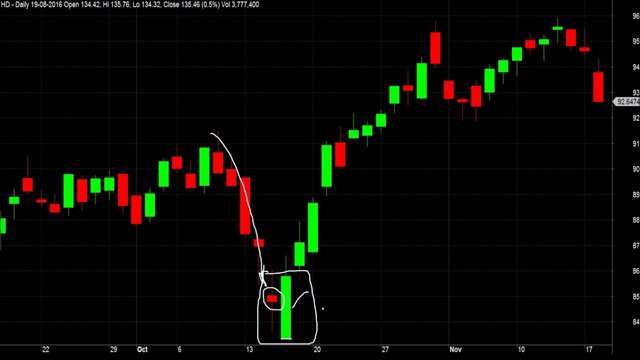
Bullish Engulfing Pattern:-
A Bullish Engulfing Pattern occurs in the market when the large white candlestick fully engulfs the smaller black candlestick. This pattern usually occurs in a downtrend and it gives the signal of Beginning of Bullish trend.
In this example black candlestick fully engulfed by the white candlestick. This means price opens lower than the previous close. However, Buyers begin to buy, pushing price sharply higher at the close and indicate Bullish movement.
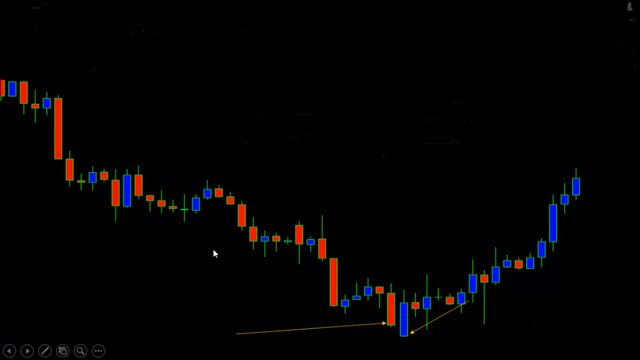
Piercing Pattern:-
A piercing pattern one of the most important candlestick pattern that an analyst may look in price series chart.This pattern formed by two consecutive candlesticks. First candlestick (red) signifying Down day and second (green) candle is signifying an Up day. When a trader watching any black candlestick followed by white candlestick this could be an alert of Bullish Reversal.
In the piercing pattern the second-day white candlestick rebound from down gap to a midpoint closing high this means support level is reached. Piercing pattern is also confirmed if it formed on the support line.
Bullish Harami:-
Bullish harami candlestick means a large candlestick(red) on day 1 and followed by smaller candlestick (green) where the second candlestick is located within the larger body.
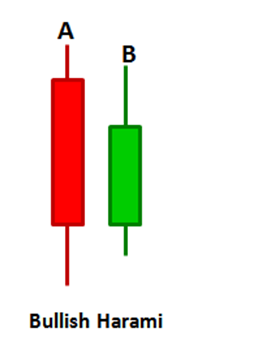
The first candlestick (red) fully engulfin the second (green) candlestick. The potential Buy signal could be generated when Bullish Harami occure with price goes higher and closing above the downtrend resistance.
Inverted Hammer:-
Inverted Hammer candlestick pattern mainly formed the bottom of the downtrend. It also alerts of change in price and reversal uptrend.
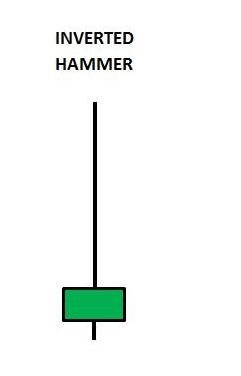
In inverted Hammer open and low is nearly the same, upper shadow length twice the length of the real body.
After a long downtrend, a formation of an Inverted Hammer is bullish because price hesitates to go down to bearish.
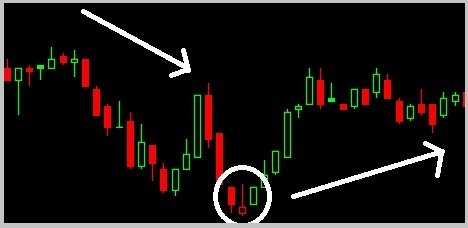
Morning Star:-
Morningstar pattern usually occurs at the bottom of the trend. In simple words, we can say large bearish candle (black) on day1, small bullish or bearish candle formed on day2,large bullish candle on day3 when such combinations of candlesticks are formed then Morning Star is occurs.
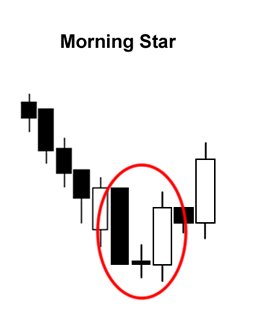
The first day started with the bearish sentiment but on day 2 it clears that bear is in control.it also indicates that reversal trend is near to start. On day 3 start with a bullish gap up and eliminate the losses seen on day1.
For detail study of candlesticks and charts, you can see Greg Morris' Book.
Hope you like the information ....
Good Luck guys and Happy trading....
Thank you for the good post https://9blz.com/bearish-engulfing-candlestick-pattern/