Learning to trade crypto: Beginners Course #1
THE START OF SOMETHING GREAT
Welcome to the world of trading, the stock markets for years have made a lot of people filthy rich and I’ve cracked how they do it and I’m sharing it with you. I believe the crypto markets are the new Stock Market. There’s a few things I would like to say which I find very important before we get into the technical side of trading. I can teach you to trade exactly the same way that I do and we could both enter the exact same trade at the same price and I could make a profit and you could still make a loss, seems confusing right? This is because there’s something nobody can teach you, the #1 reason most people aren’t successful traders is because, believe it or not, your emotions are the hardest part of becoming a successful trader. Only time and discipline can teach you the risk management and emotional control you are going to need to be a success. Accept now that 99% of the time you’re going to lose money when you start off, but push through it and force yourself, ask yourself how badly do you want it, I know I wanted it more than anything else and because of that I got it! You need to accept that you’re going to have sleepless nights and many days where you feel like you’re losing your mind and going crazy, but this is all part of the process and is necessary, trading is easy, having control of the trade is the difficult part. A little bit of sacrifice for a lifetime of wealth and money management. We are all human and we all suffer from greed, greed is one of the biggest factors in losing money in trading, for example if we up 1000$ in a trade we will say but what if I can get 2000$ out of it, you need to step back and realize that if you do 1000$ each day that’s a total of 365 000$ /year. Grow your portfolio with your knowledge and experience.
“The sooner you stop trying to make quick money, the sooner you actually make quick money.”
Understanding “Candles”:
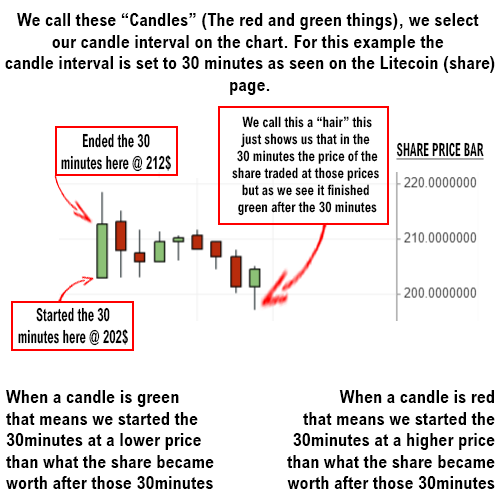
Technical Analysis (TA)
Technical analysis is a form of analysis that we use on the stocks charts to predict which direction the price is going to go. This helps us see when we should buy a share and when we should sell a share. TA has been around for years even before computers existed. Now in my opinion the reason TA works is because every single trader uses it which is what makes it valid if everyone is expecting a price to reach an average area they going to be the reason it reaches that because they all buying and selling according to this. Technical Analysis can get really complicated and fancy, I find that the simpler TA works better then the fancy complicated TA and this is because in my opinion more traders know the simple TA and not the fancy stuff. I recommend using www.tradingview.com for all your TA, drawing TA on an exchanges chart is inaccurate and very limited.
First thing first let’s learn about trend lines:
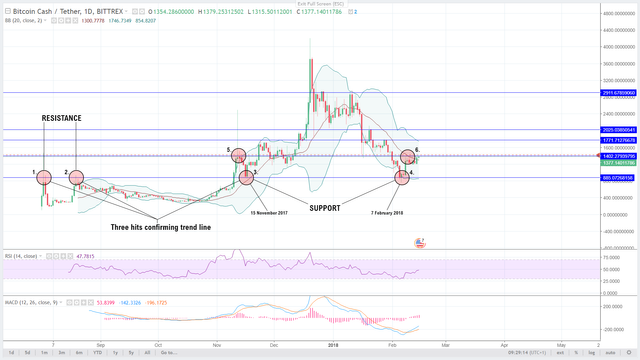
As seen above we find resistance (1 & 2) by looking for a price that the share bounces down from. We see that twice as circled in red that point 1. And 2. Is where the share struggles to pass, so we mark this as resistance with a blue line. When we break resistance that is a very good buy signal, this will almost always result in the share price going on a good increase until the next resistance(5) is met. Now that we above the resistance, that makes it the support(3) now, where the share will struggle to go under in price now.
So we break resistance marked on the chart using point 1. And 2. To identify it. We then found a new resistance at 5. As we can see the share then came down and bounced on the previous resistance as its now support this is marked as 3. A few months later when the share retraces back down, we can see at point 4. That the support still holds, and at point 6. That the resistance still holds, these lines get stronger in validation the longer time period they play out over.
Now that we’ve learnt about the horizontal trend lines and what support and resistance is, let’s take a look at some different types of trend lines that aren’t horizontal:
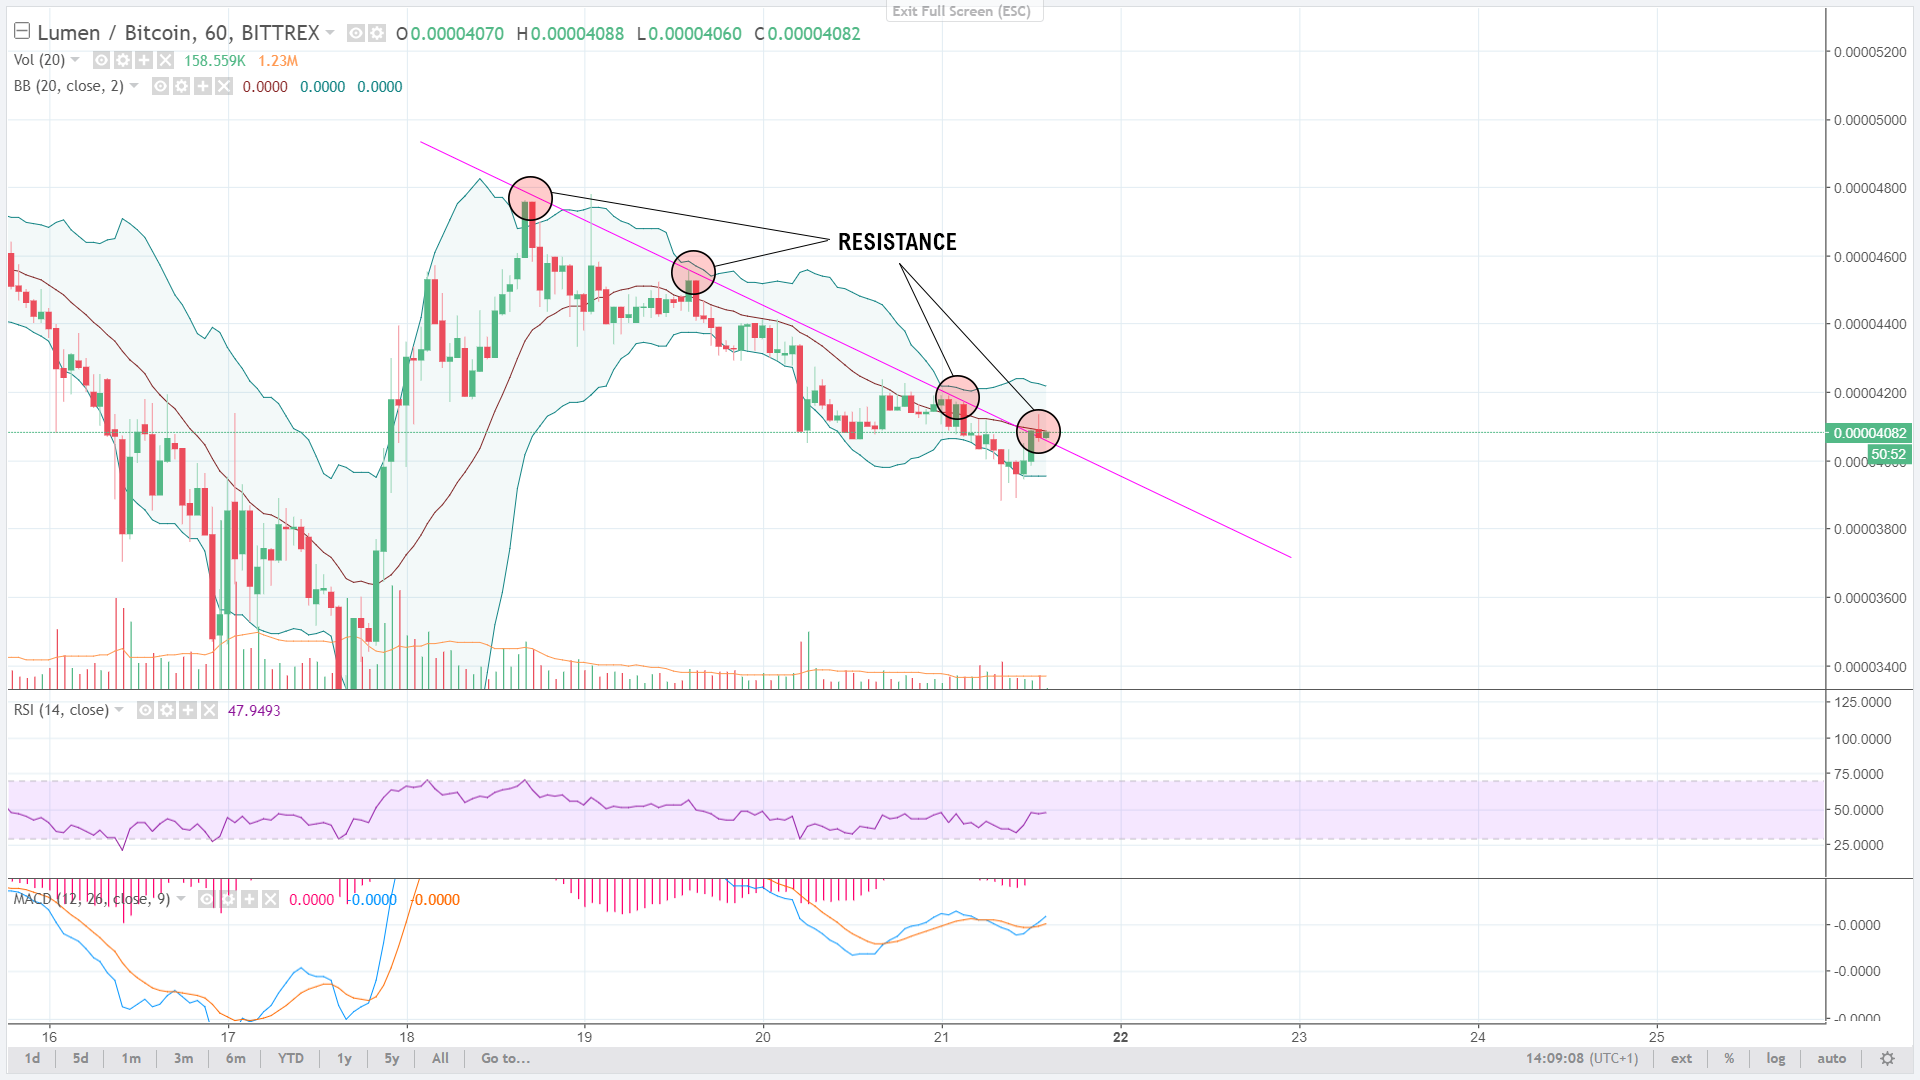
As we can see in the image above there is a downward resistance line which it has tested four times and failed to break. This shows us that we are in a downtrend until we manage to break this resisting point. Let’s take a look at this chart a few hours later:
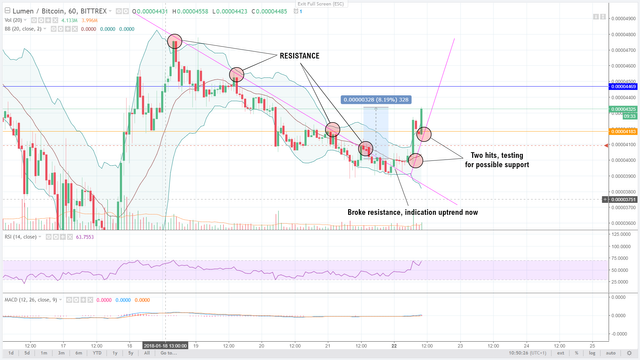
As we can see we broke the resistance line (It only counts as a break once the candle finishes out of the resistance, so if it’s a 1H candle only once tht 1H of trade time finishes and a new candle starts), when we broke the resisting down trend that now means we reverse and go into an uptrend as seen. Now the trick is to hold that share until it breaks support.
Resistance and support is the simplest part of trading but is the most important and most powerful, lets now take a look at some trend line patterns:
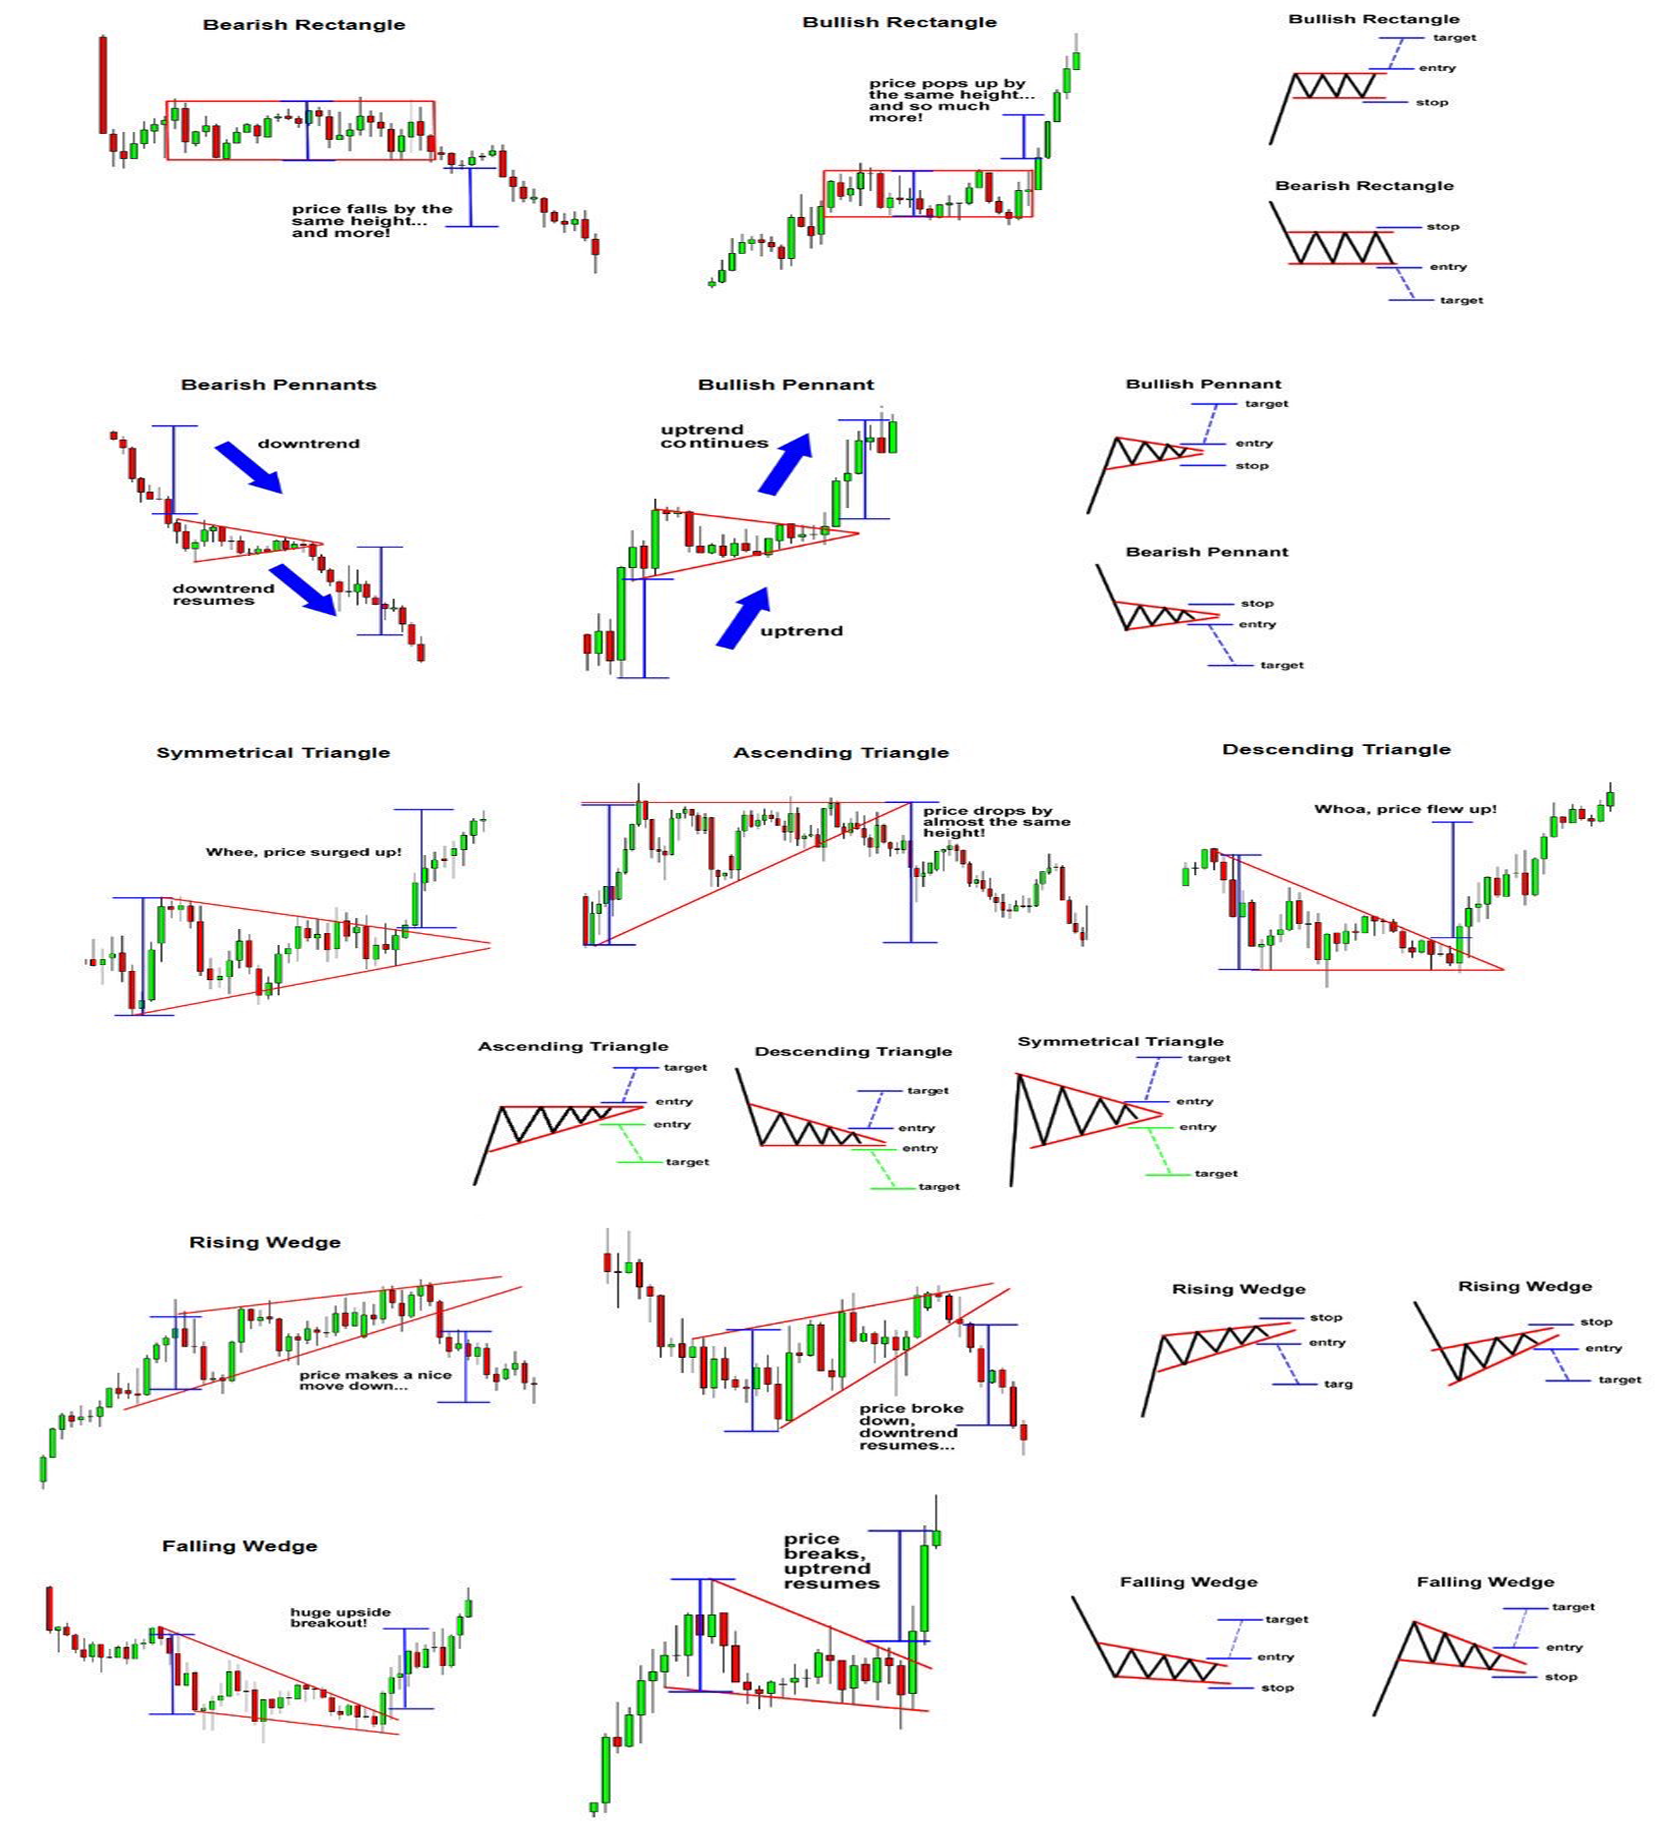
These are patterns that are made from trend lines, it is very important to know these.
Support and resistance lines play a very big role in trading, we use this to see which direction the price will go in and where its stopping points are to try find the lows and the highs so that we can buy low and sell high. Never rush a trade, wait for it to break resistance and then only enter the trade. If it breaks support follow it down and find where it bottoms out and wait for it to break the closest resistance to the bottom before entering the trade. Always trade safer and never have “hope” for a trade, follow your technical analysis.
With every single trade you do it is VERY IMPORTANT to do risk management, this is how you will build yourself a successful trading portfolio, lets take a look at how we manage our risk/reward ratio:
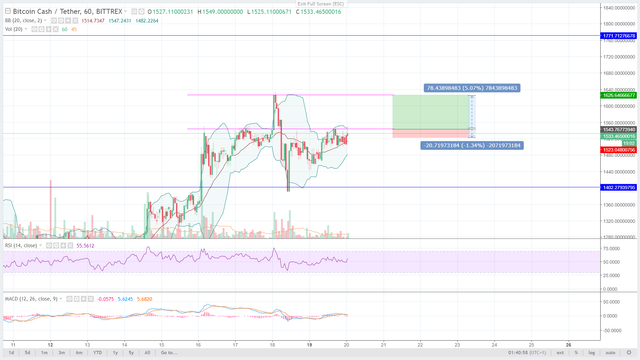
As seen above we are waiting for the share to break resistance before entering the trade, if we enter the trade upon break of resistance we then are going for a 5% trade, but what if the market flips? Where will we set our stop loss? If I’m going for 5% profits I’m only willing to lose 1.5%. So once I enter the trade my two targets are 1626$(+5%) and 1523$(-1.5%). Whichever price reaches first is the one I will sell at. This is what a lot of people struggle with, but as I’ve said you have to follow your TA and not be emotional, rather sell at a small loss than risk being caught in a massive drop which could liquidate you or get you stuck in the trade for months, because if you sell at a small loss, you can then re-enter the same market at a cheaper price and make back that money plus more when it bounces on support.
When a market has topped out and is retracing its way down, there is a tool that can be very helpful with finding these support and resistance lines, we call this the FIB retracement levels and this is how to use it:
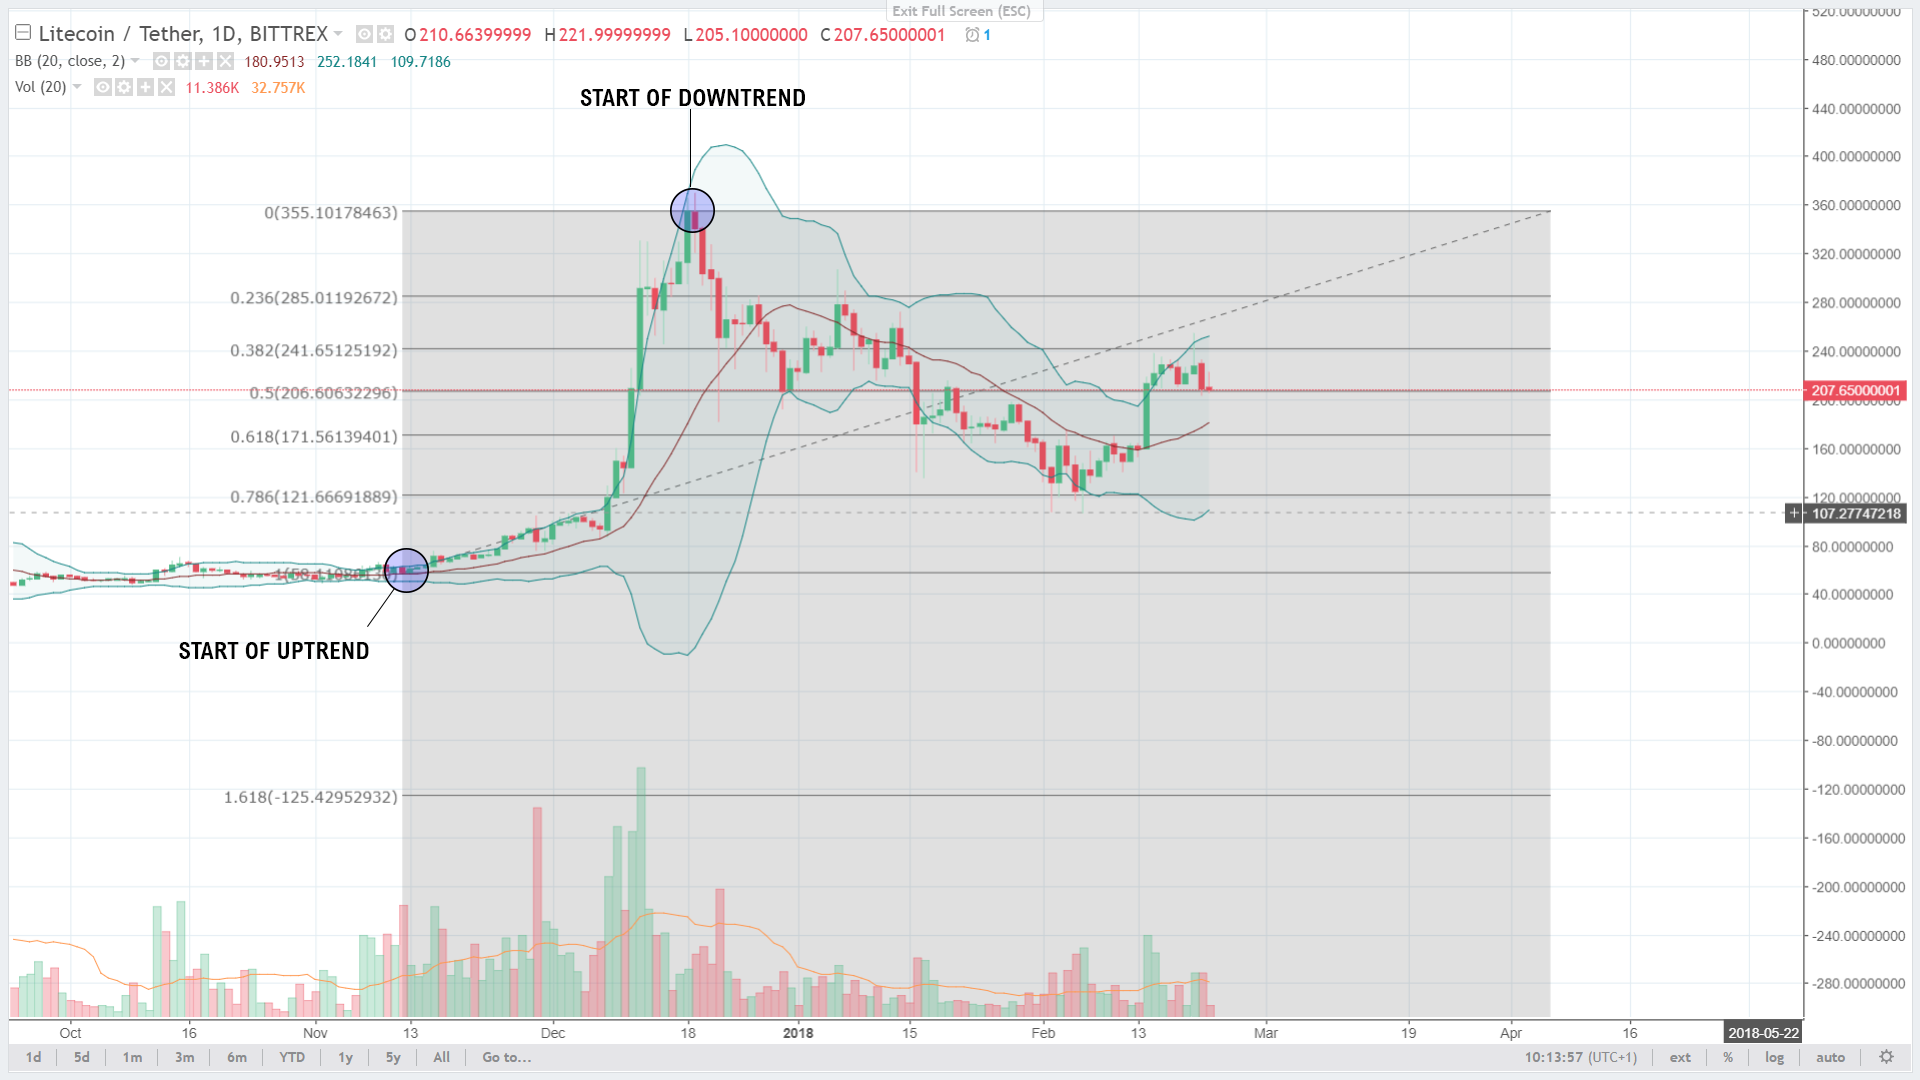
Once you’ve selected the FIB retracement tool, you must select the start of the uptrend and the start of the downtrend. We would use the FIB retracement as guidance, as we can see on the image above the retracement lines drawn by the FIB were fairly accurate at finding the support and resistance lines. Remember trading is constantly a flow you’re trying to ride with so you need to follow multiple trend lines to make sure you getting into the trade at a safe entry and where you know what your next move is weather the market is going up or down.
Even though trend lines are accurate and show us points of support and resistance, we cannot rely on only trend lines, so we use what is called “indicators” too. We need multiple indicators (Trend lines count as an indicator) to show us a positive movement in the market not just one, so let’s learn about the other indicators I use and how I used them.
Remember there are so many different indicators to use, but these are the ones that work for me and how I read them.
- MACD
The moving average convergence divergence (MACD) is a trend-following momentum indicator that shows two different moving averages of price. The MACD is calculated by subtracting the 26-day exponential moving average (EMA) from the 12-day EMA(This is represented as the orange line). A 9-day EMA is also placed on the indicator (the blue line):
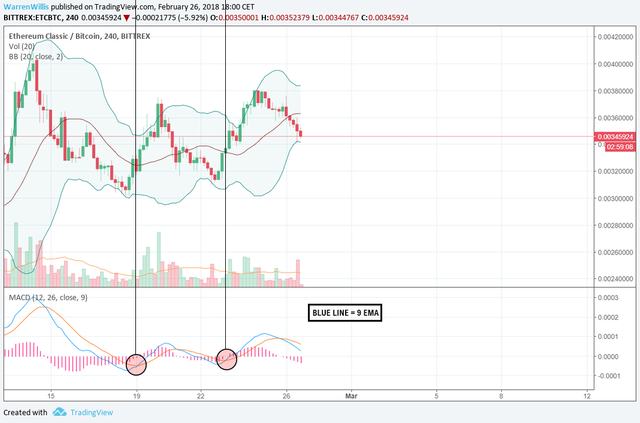
As you can see this indicator can be very useful when we see the blue line cross and break the orange line, the market carried on up trending. It is very important for the candle to close and the blue line to be clearly broken through the orange line as this can also be used for resistance and you will see the blue line bounce off the orange line. Back in the direction it approached from.
- RSI
The relative strength index (RSI) is a momentum indicator that compares the magnitude of recent gains and losses over a specified time period to measure speed and change of price movement. It is primarily used to attempt to identify overbought or oversold conditions.
When a share is up in value it can be because its been overbought and that’s not “healthy” meaning the price has only increased due to buying pressure meaning its due to come down a little, and when a share is down in value it can also be because it was oversold which also isn’t “healthy” mining it needs to come up a little in price.
I like to draw down trends and up trends on the RSI the same way I would on a normal candlestick chart as this is just as relevant as any trend on that share it is a very important factor for me.
Let’s take a look at the RSI indicator:
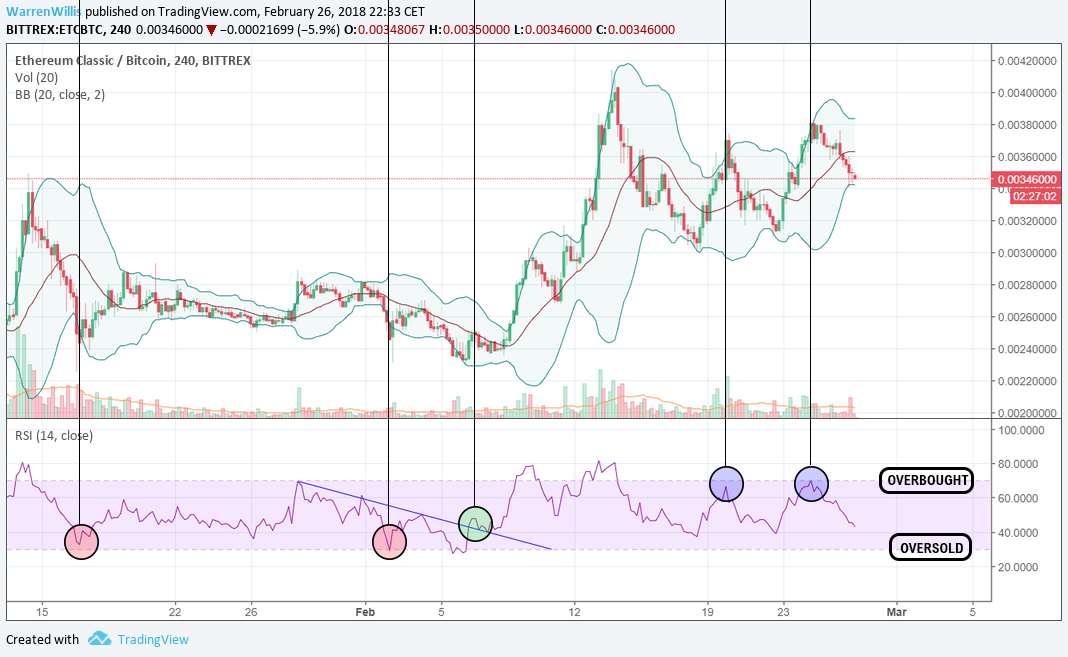
On the RSI the purple channel is the “healthy” area. As we can see with the red circles on the chart when it hit the oversold line the share immediately pulled up, this doesn’t mean the shares going to uptrend but this is an opportunity for a quick buy and sell.
You can see my down trending blue resistance line, this line got broken (The green circle on the chart) then the RSI came down and bounced back up from the blue line which is now support because we above it and the market up trended from there.
If we take a look at when the market reached the overbought line (The blue circles on the chart) it bounced down and the shares price followed it.
Now if we combine all that we’ve learnt, using trend lines and the two additional indicators lets see what the chart would look like then and how this would’ve helped reading the price direction of the share.
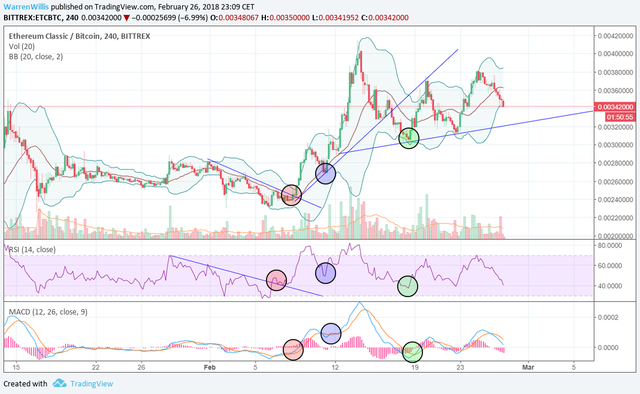
a) Red Circles:
First positive sign would’ve been the break of the downtrend on the RSI indicator, our second positive sing within a short period would be the downtrend breaking on the chart, this is already now a very strong trade. We have our third positive sign on the MACD indicator with the blue line clearly pulling away from the orange line.
b) Blue Circles:
We would first look at our MACD indicator as this didn’t sharply come down when it started to curve and when the blue line approached the orange line it held its position there and then the blue line started to lift away from the orange line again. Secondly when we got a bounce on the chart our RSI indicator also sharply turned around and started going back up. We would now be able to draw a support line based off this.
c) Green Circles:
As explained with the MACD indicator we can see that its looking to cross up again and it does so successfully which is positive. We also get a sharp bounce on the RSI which now allows us to draw another blue support line there which we can see further down the chart worked perfectly.
The above technical analysis that we’ve just gone through is literally the only TA I use, like I previously said there’s so many different forms of TA but I prefer to keep it simple because it works. I work smarter instead of harder, everyone has this impression that you need to sweat to make big money, I laugh at them. You need to constantly keep using your TA and with time you will learn to not be emotional and to follow your TA.
There’s a few tips that you should follow while using your TA:
• Wait for the candle to close before buying or selling, as the share could break through a resistance or support line but not close through the line which means the markets going to go in the exact opposite direction you were expecting.
• Never panic sell follow your TA, you are going to watch your money go up and down accept this and have patience.
• Never FOMO buy you can always get the next one, otherwise you will get REKD.
• If you haven’t planned your risk management, don’t do it.
• ZOOM OUT, make sure you check the 1D & 4H charts first to find which direction the market is trending in before trading the quicker timeframes.
• Never force a trade or have hope for a trade wait it out and make sure of it, remember you can lose your money quicker than you make it.
• Always look for volume when nearing resistance/support, because without good volume chances are you not passing your resistance/support.
• Never hesitate to sell at your stop loss, rather lose a small percentage than be stuck in a trade for days/months.
As tempting as it is to go all in with trading, you will be far more successful if you diversify your portfolio properly.
Fundamental Analysis (FA)
Fundamental Analysis is evaluating a share and following all the news and progress of a company this is all the ground work. Fundamental Analysis is a MUST, you will hear often people will tell you to do your own research (DYOR) because if you’re taking your money and investing in a share weather it be for a few days or for a few months you should most definitely know what you’re putting your money into, especially if you want to trade the Crypto markets! Let’s take a look at some of the FA techniques I use: (The info is old)
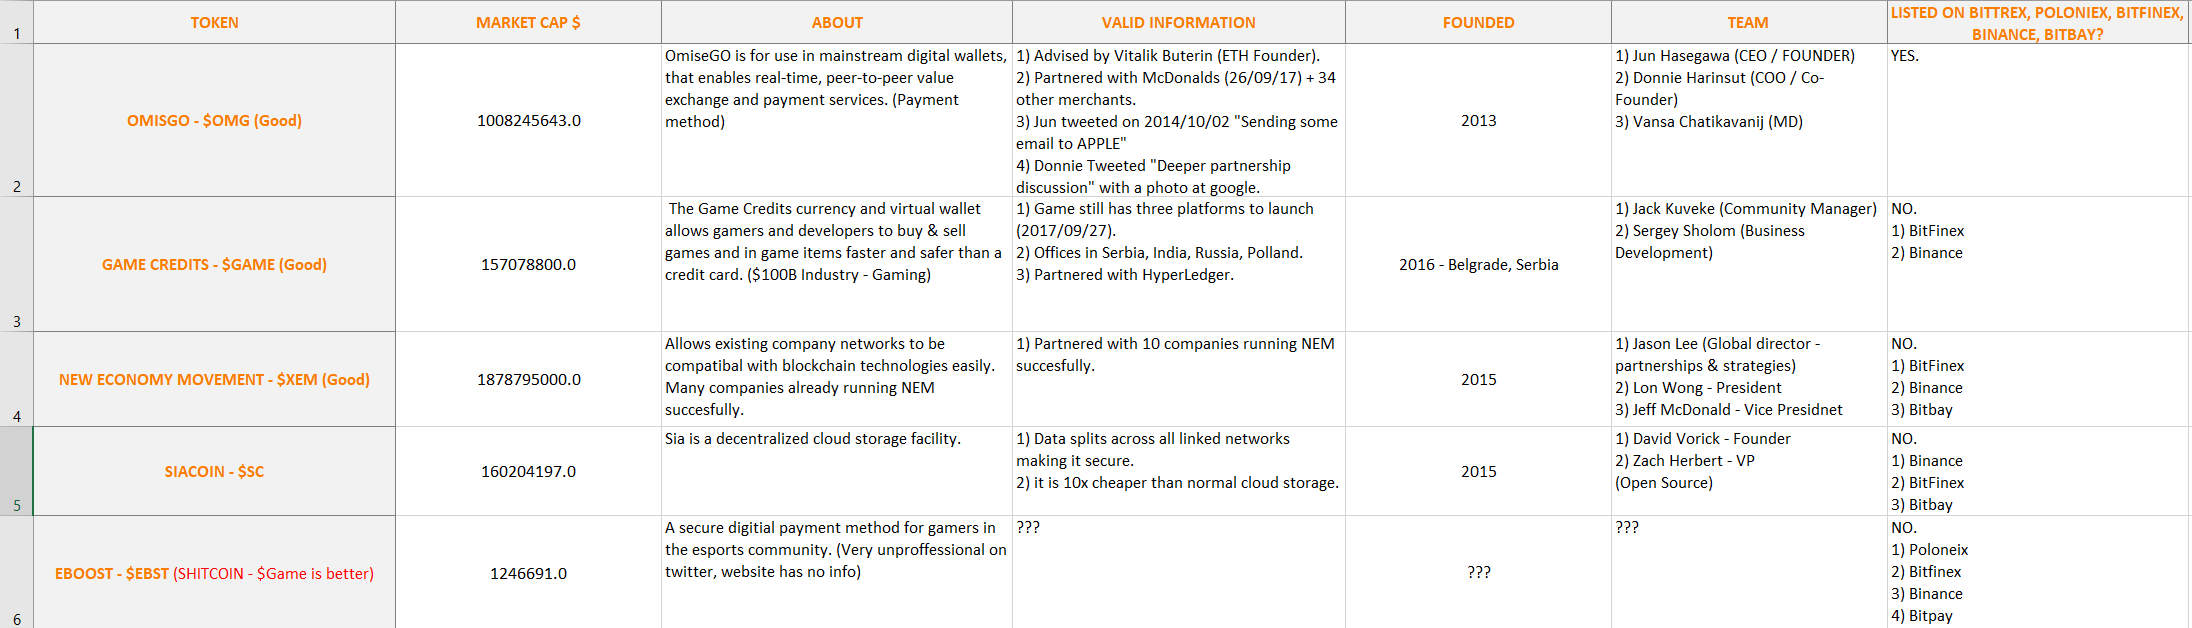
The above spreadsheet is where I write down my FA on a company so that I always have something short and simple to look over because you’re not going to remember everything about every company unless you write it down.
Market Cap: The market capital is the total amount of shares held by investors multiplied by the value per each share which gives us the total amount of money the shares are worth called the market cap. It helps you measure your risk of investing in the share because with the market cap you can compare it to competing shares in the same line of work and determine weather you think its undervalued or overvalued. You want to be invested in a share that’s market cap is going to grow.
About: This is where I write a short description of what the share is, so that I can quickly look at it and remember ok this company does that.
Valid Information: I write down a list of things I’ve discovered about the share that are appealing to me which I feel will possibly affect the company in the future weather it be positive or negative.
Team: Any team member of the company that I can find or know about I write down their name and position, I the go through social media and try find them, ill follow them and turn on notifications so that if there’s any leaks or announcements I can get them first, twitter is a business hub, it thrives.
Listed On…: This only applies for Crypto trading, this is a list of the top exchanges that buy and sell these shares, so now if a share isn’t yet listed on all of them that’s important to me because that means when it does get listen on the exchange more money comes into the market cap which almost always increases the shares value.
Fundamental Analysis is very self-explanatory, its just a process that’s all. Select a share and go to their website. Scroll through there website read everything about them and look for key points, for example, who are the owners, directors, etc. Do they have company white papers (The white paper is everything about the company, their vision, aims, goals, when they were founded, literally everything) and a road map? A road map normally works in yearly quarters so in Q1 they aim to achieve A B and C then Q2, Q3 and Q4, most of the time you can get hold of their old roadmaps too, I like taking the old road maps of the year before and comparing it to what the company did that year, did they achieve all their quarters successfully and if not did they communicate with the share holders and always keep them in the loop.
Research the names of the important people like the Directors and CEO’s, if they’ve been involved in any dodgy business or bad deals trust me google will tell you all about it, but be sure to also run their names through social media to see what the people have had to say about them. This also applies to the company as a whole, read up reviews of them. Is their service good, is the customer satisfaction there? These are all things that are small but will benefit you.
Almost every single company that hands out shares has different forms of communication groups for the investors, weather it be a thread, blog or social media group. Look through these and see if peoples questions get answered and weather or not the company is active on their communication group, for me it is very important that they are active and keep shareholders informed.
Always look for the companies registration number and address, validate their registration number online there are multiple sites that allow this, and view their address on google maps to make sure its not actually a tin house and that it is a legitimate company.
Follow me on twitter for the upcoming courses to be posted @CryptoFrenzi
Congratulations @warrenwillis! You received a personal award!
You can view your badges on your Steem Board and compare to others on the Steem Ranking
Vote for @Steemitboard as a witness to get one more award and increased upvotes!