Steem: Application usage - Where is the engagement being sourced from, and are any applications showing signs of growth?
Repository
https://github.com/steemit/steem

Original image adapted from pixabay
Contents
1 Introduction
2 Scope
3 Results
2018 - an overview
Popular applications - January to October and October alone
Growth applications - Posts/Comments
4 Conclusions
5 Tools and Scripts
Introduction
This is an analysis of the engagement activity, with regards to top level posts and comments, of the applications using the Steem blockchain in 2018.
The other day, I was asked the following:
Can you crunch the numbers on engagement (posts and comments) from the top Steem apps? A post that looks at which apps are growing, and how many people are posting and commenting on the apps.
Last i heard it was steemit, busy, and partiko as the top 3. I don't think people realize that the top 3 are steemit, busy and partiko, and they mistakenly believe what ned says on steem.com where he doesn't even mention busy or partiko.
I immediately sent over 'miniature-tigers' excellent monthly summary but realised the request was for a wider scope with regards to the time-frame. Hopefully, the following is suitable.
The aim of this analysis is to:
- Provide an overview of application activity in 2018
- Compare the full year activity with recent activity
- Present any positive findings with regards to application growth during the bear market
Scope
The time period assessed are from January to October 2018 inclusive. Data has been collected for all applications and this is used for the first half of the report. The top 20 most popular applications in the month of October are then used in the later part of the text.
Results
2018 - an overview
Most of the accounts present on the Steem blockchain this year will likely be aware that the number of posts and comments have steadily fallen. But by how much? And what are the time-frames?
The following charts display the number of top level posts and comments each month, along with the number of unique applications used.
Top Level Posts
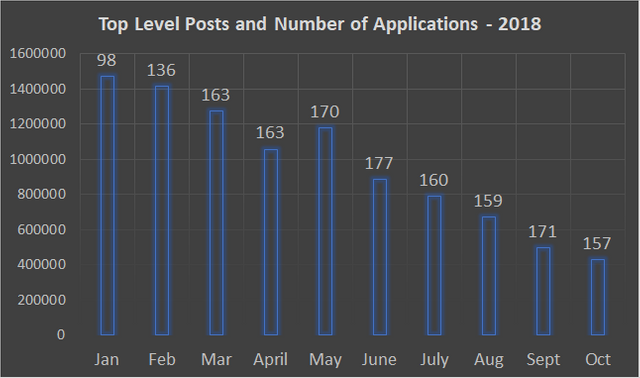
From close to 1.5 million top level posts in January 2018, October totaled around 429 thousand - a 70% reduction. During this time, only May bucked the downward trend. The peak month for unique applications was June, 79 more than the first month of 2018, and 20 more than October. Personally I would expect this figure to have been rising steadily this year, perhaps at the end of the first quarter 2019 (planned SMT release) this figure will really start to move.
Comments
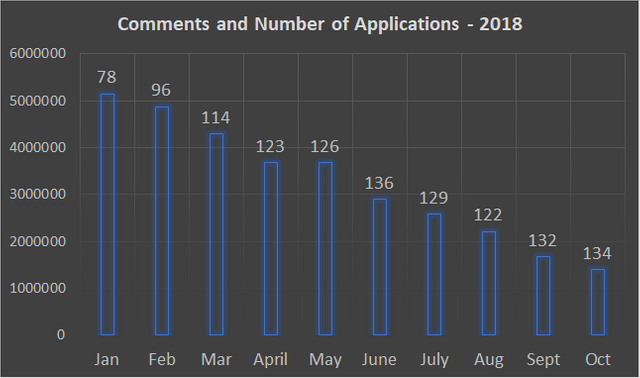
In January 2018, over 5 million comments were written/coded via 78 applications. 1.4 million comments were produced in October - close to a 73% reduction. As with the top level post figures, the number of unique applications used to comment has steadily risen in 2018, the peak was June and from here the number fell a little but is almost at this figure again in the month of October.
It's interesting to note that the unique posting application numbers are ahead of the number of applications used to comment each month. In January, 20 more applications were used to post, than to comment, and in March, this figure had changed to 49. It seems like there is a lag between new application adopters posting, and curators using the a new application to comment - unless that is the purpose of the application (e.g. FastReply). Scripting applications could also be throwing the numbers a little, and I would in time expect the number of applications used to post and to comment, to move closer together.
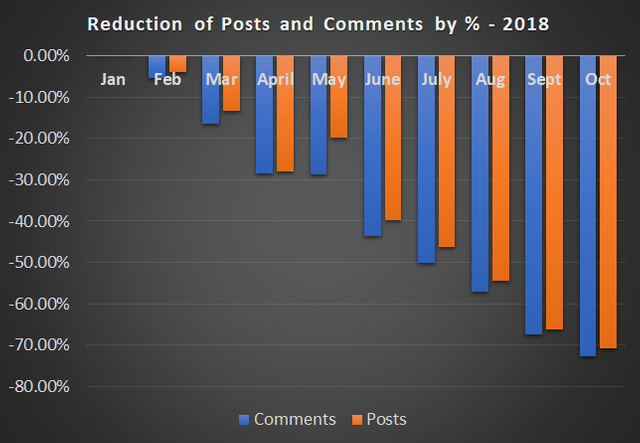
The following chart presents the same data but in percentage terms. It's possible to spot the slight uptick in comments and the reasonable increase in posts in May, but generally the decline in numbers is very apparent.
Popular applications - January to October and October alone
The results are split into posts and comments. The 20 most popular applications (in terms of the number of posts and comments) have their own pie slice, and the remaining number of applications are grouped as 'Others'.
'null' is the total number of posts/comments via applications that have not presented a name in the JSON metadata.
Posts
January to October 2018
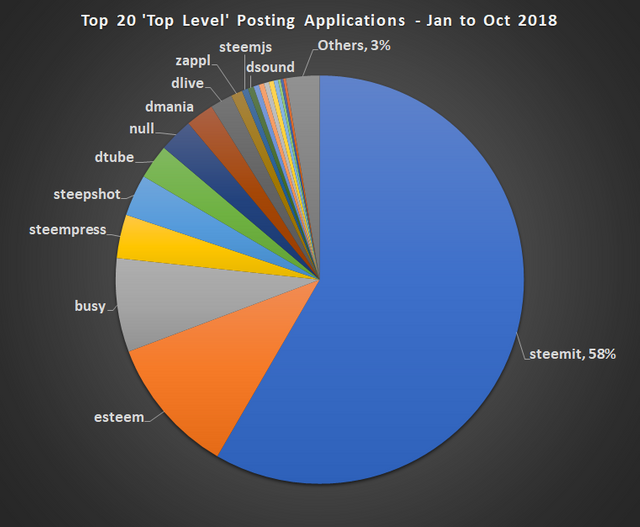
For the full time period of the data collected, 'steemit' shows to be the source of 58% of all the top level posts submitted to the Steem blockchain. (This figure is not to dissimilar to steemit inc. market share of Steem Power?) A total of 463 unique applications were used to create a top level post between January and October, the top 20 applications creating 97% of these posts. (Others 3%)
October 2018
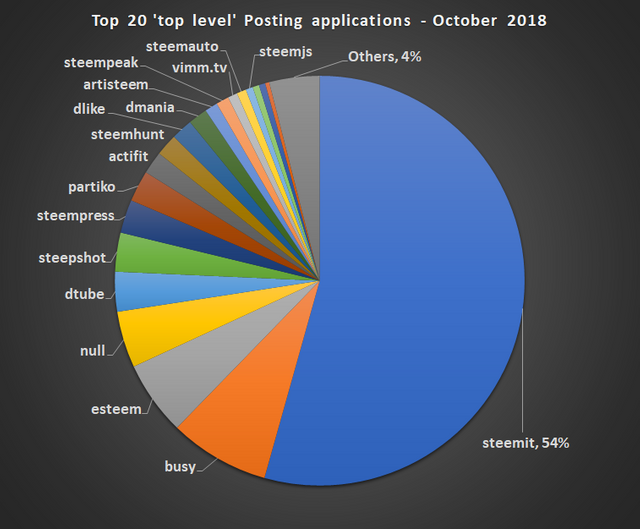
In October, the 'steemit' market share had fallen 4% in comparison to the full year to 54%. 'Other' applications had gained a percent in comparison to the full data set. Unless a new 'killer' application takes the Steem ecosystem by a storm, I would expect the 'steemit' monopoly to decline steadily, perhaps along with many of the listed applications, whilst 'Others' could show the most growth in coming months.
Comments
January to October 2018
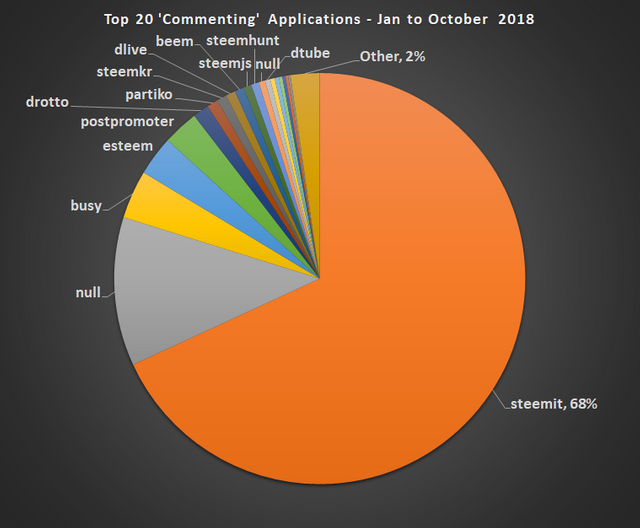
From January to October, a total of 324 unique applications were used to make a comment - 139 less than the number used to create a top level post. 'steemit' accounted for 68% of all the comments produced, 10% more than the 'top level post' percentage.
'null' appears as the 2nd most popular, and these comments are likely to be scripted. 'Others' formed only 2% of the total.
October 2018
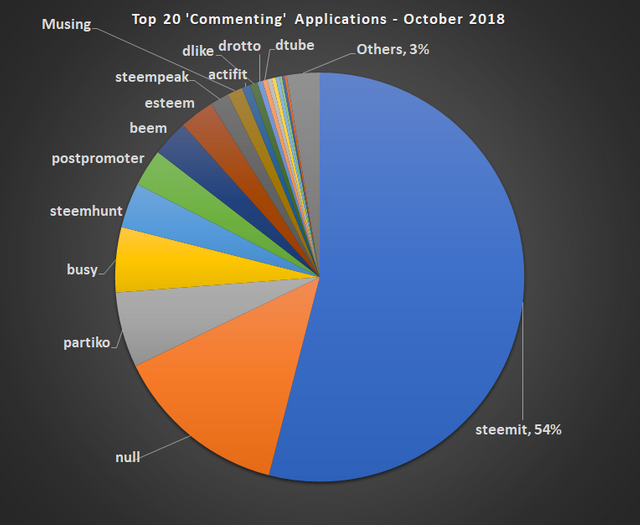
In October, 'steemit' accounted for 54% of all comments produced, a 14% decline in comparison to January-October, and exactly the same figure as the 'top level posts'. And as with the posts, the 'Others' grew a single percent.
It's pleasing to see a reduction in the percentages of posts and comments produced by 'steemit', and I think steemit inc would agree. I would expect to see this majority percentage continue to decrease as we move forward into 2019 - In many respects, the rate at which this decline occurs is down to the quality and usability of the applications. I do not expect to see a market share like the above in the future.
Growth applications - Posts/Comments
This final section focuses on the top 20 posting/commenting applications and looks into the ones that have shown growth in recent months.
The top 20 applications in October 2018 (for posting and commenting) are used. For example, 'dlive' is in the top 20 most used posting applications for January-October, but is not included in the results below because the application was not in the 20 most used for the month of October.
Posts
The top 20 posting applications, January to October 2018.
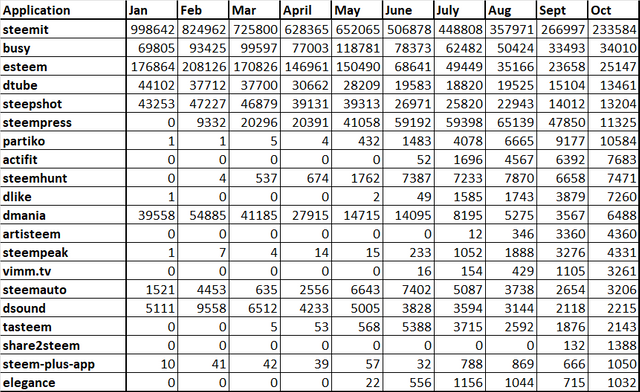
8 of the top 20 posting applications for the month of October have declined in use from the beginning of the year. 'steemit' (77%), 'dmania' (83.5%), and 'esteem' (86%) are the worst casualties.
However, this means that there is growth in the majority of the top 20 posting applications of October, in light of previous months. Using the chart below to represent the applications growing in post count, we can see that 'actifit', 'dlike', and 'steemhunt' have grown to around 7000 posts each in October, 'steemhunt' being live 3/4 months prior to the first two mentions.
Growth applications - Posts
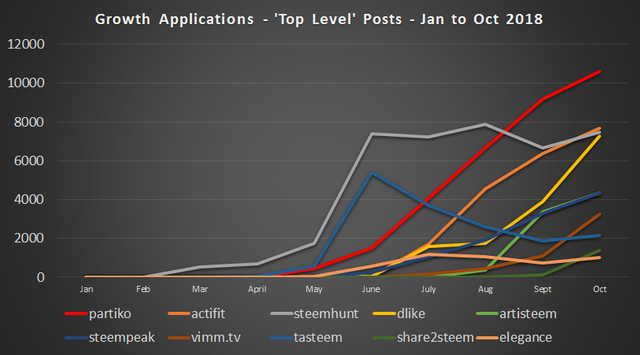
The clear 'winner' however is 'partiko'. Although present in the data from January (possibly in under a testing phase), the numbers didn't start to move until June, and since then, they have risen month on month to October in which over 10000 top level posts were produced.
Comments
The top 20 applications in terms of comments, January to October 2018.
9 of the top 20 applications (in October 2018) used to create a comment have seen a reduction in growth. 'steemit' (81.5%), 'dtube' (81%), and 'drotto' (93.5%, scripting) have suffered the biggest fall since the beginning of the year.
Again, a look at the positives and the applications seeing growth in comments produced, presented in the chart below. 'actifit', 'dlike', and 'musing' all appeared in June/July, and it is the latter of the three that has shown the most encouragement with regards to comments. This is most likely due to the possibility of being rewarded on a comment - Where there is SP, there is activity.
Growth applications - Comments
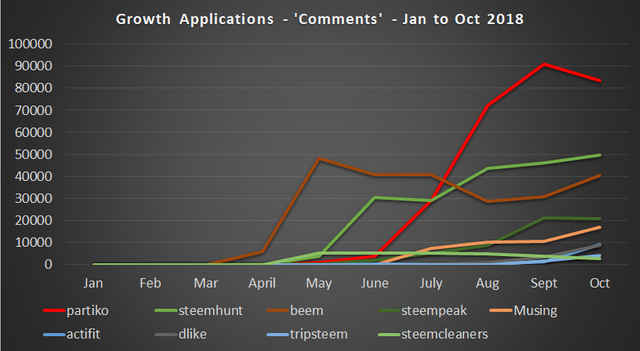
'beem' is a scripting tool/application, peaking in June and falling back, it looks to be the most popular choice at present for those automated replies/comments we all love to receive and the numbers are on the rise again.
'steemhunt' which appeared in May has produced the 4th (excluding 'null') most comments in October and has generally grown month by month, albeit fairly steadily since June.
As with the post numbers, the clear winner as far as growth is 'partiko'. From 1000 in May, to almost 91000 in September, 'partiko' has seen rapid growth over the past 6 months. Excluding 'null', 'partiko' produced the 2nd most comments on the Steem blockchain for the months of September and October, overtaking 'busy' in the process. One factor could be that each comment produced via 'partiko' is signatured with a link to the application. However, this will bring users to the application, but they are unlikely to stay unless the tool is suitable. Clearly 'partiko' (with a mobile application as are doing well in this regard. I should probably download it?
Conclusions
- Posts and Comments are down over 70% from January 2018 to October 2018
- The number of applications have grown steadily throughout the year, peaking in the summer but not far from these totals in recent months
- 'steemit' still holds a majority share as the window to the Steem blockchain, but this share has fallen since the start of 2018
- There is growth amongst many of the newer applications, a positive for sure
Tools and Scripts
- LINQPad 5
- SteemSQL (by @arcange)
- Excel
Scripts as follows:
-- All applications, Posts total, January 2018, grouped by application

SELECT
     IIF(isjson(json_metadata) = 1, IIF(CHARINDEX('/', json_value(json_metadata, '$.app')) > 0, SUBSTRING(json_value(json_metadata, '$.app'), 1, CHARINDEX('/', json_value(json_metadata, '$.app'))-1),json_value(json_metadata, '$.app')), null) as [SummarisedApp],
    Count(Comments.author) AS [Posts]
FROM
    Comments (NOLOCK)
WHERE
    YEAR(Comments.created) = 2018 AND
    MONTH(Comments.created) = 1 and
    depth = 0
GROUP BY
    IIF(isjson(json_metadata) = 1, IIF(CHARINDEX('/', json_value(json_metadata, '$.app')) > 0, SUBSTRING(json_value(json_metadata, '$.app'), 1, CHARINDEX('/', json_value(json_metadata, '$.app'))-1),json_value(json_metadata, '$.app')), null)


-- All applications, Posts total, full data set, grouped by Application

SELECT
     IIF(isjson(json_metadata) = 1, IIF(CHARINDEX('/', json_value(json_metadata, '$.app')) > 0, SUBSTRING(json_value(json_metadata, '$.app'), 1, CHARINDEX('/', json_value(json_metadata, '$.app'))-1),json_value(json_metadata, '$.app')), null) as [SummarisedApp],
    Count(Comments.author) AS [Posts]
FROM
    Comments (NOLOCK)
WHERE
    YEAR(Comments.created) = 2018 AND
    MONTH(Comments.created) BETWEEN 0 AND 10 and
    depth = 0
GROUP BY
    IIF(isjson(json_metadata) = 1, IIF(CHARINDEX('/', json_value(json_metadata, '$.app')) > 0, SUBSTRING(json_value(json_metadata, '$.app'), 1, CHARINDEX('/', json_value(json_metadata, '$.app'))-1),json_value(json_metadata, '$.app')), null)


-- All applications, Posts total, grouped by Application, Year, and Month

SELECT
     IIF(isjson(json_metadata) = 1, IIF(CHARINDEX('/', json_value(json_metadata, '$.app')) > 0, SUBSTRING(json_value(json_metadata, '$.app'), 1, CHARINDEX('/', json_value(json_metadata, '$.app'))-1),json_value(json_metadata, '$.app')), null) as [SummarisedApp],
    MONTH(Comments.created),
    YEAR(Comments.created),
    Count(Comments.author) AS [Posts]
FROM
    Comments (NOLOCK)
WHERE
    YEAR(Comments.created) = 2018 AND
    MONTH(Comments.created) between 0 and 10
    AND depth = 0
GROUP BY
    IIF(isjson(json_metadata) = 1, IIF(CHARINDEX('/', json_value(json_metadata, '$.app')) > 0, SUBSTRING(json_value(json_metadata, '$.app'), 1, CHARINDEX('/', json_value(json_metadata, '$.app'))-1),json_value(json_metadata, '$.app')), null),
     MONTH(Comments.created),
    YEAR(Comments.created)

Change 'MONTH(Comments.created)' for a different data range, and 'depth' to <> 0 for Comments
Cheers!
Asher
Hi Asher, great work! We've seen the decreasing numbers of posts and comments at various occasions before, but having it summarized for a larger time range makes it even more visible what's was going on (or not) in the last couple of months. I found a market share report from around a year ago with Steemit at around 80% - we're far more diverse now! We've seen several dApps grow despite the overall decreasing usage numbers, and your work confirms that a lot of them still see a steady increase. Good news that we desperately need right now :)
One remark on the numbers, though: I think comparing the general October app share with the share across the full year has to be taken with a grain of salt, especially since the total numbersof posts and comments decreased by a considerable fraction since January.
Your contribution has been evaluated according to Utopian policies and guidelines, as well as a predefined set of questions pertaining to the category.
To view those questions and the relevant answers related to your post, click here.
Need help? Write a ticket on https://support.utopian.io/.
Chat with us on Discord.
[utopian-moderator]
Hi @crokkon, nice find on minature's work last year and really nice to see the market share of 'steemit' continuing to decline - it's what they want i believe!
I agree that we should be weary about comparing the previous months numbers with the whole year, you can get away with it slightly by using %'s i guess. Still, i think the data gives some positive indicators,] and that's what I was looking to try to present in what is a tricky period for all involved.
Thanks for the review!
Absolutely, and the per-app numbers that you've shown clearly confirm this trend!
Thank you for your review, @crokkon! Keep up the good work!
Well, the decline in comments and posts is definitely sad to note, but there are some positive things - the rise of apps, definitely. Just reinstalled Partiko on my phone. I've been keeping away from the apps, mostly, but it seems impossible (and unwise) to do so now, so better see what it's all about:)
Reinstalled? Well you've done better than me. I do hear constant rave reviews so they must be doing something right.
Thanks for dropping by :)
Hi Asher. it will be very interesting to see the current figures now as there has been another drop off in the last week or so.
Yep, November (as we are not done) was excluded, but you can sense that there will be a decline again for those in that trend - perhaps the likes of partiko are still pointing the right way though...
I would expect to see a bigger drop in the number of posts and comments in September due to HF20. How come there is nothing extra? No spam reduction as was promised?
Posted using Steeve
Interesting isn't it?
The majority of the spam has been gone for a while in my opinion, I would say at least 4/5 months.
HF20 cut a few of the scripted reply bots, and some of the new people just keen to get engaged. It would have been fun to see what effect HF 20 would have had in January of this year :)
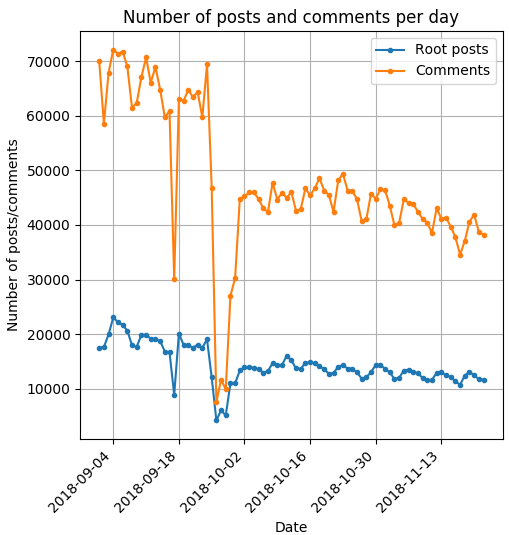
I think this is partly averaged out in the per-month granularity chosen here. The number of post and comments per day when the blockchain was "usable" wasn't too much lower in September than in August. Due to the few days outage with very few posts at the end of September, the September totals already see a reduction wrt to August. The HF then resulted in another reduction, esp. for comments, in October. Here's a close-up view of the per-day stats across the HF:
This looks more in favor to the HF20 anti-spam effect. Thanks for bringing this in!
Posted using Steeve
Wow that is a huge drop in engagements (post,comments)
You would think the reward pool would be higher then it is currently being distributed to the people still engaging, Or is more going to null/dust
Yes very much so, but there is hope (as hopefully the last section details).
The voting has always been different to the posts/comments. A sign that a lot of the voting is pre-arranged i guess.
Dude! All those numbers make my vision blur, but good on ya for putting this together. ;) It's sweet to see the way different apps are taking off.
Yeah I'm seeing pies when I shut my eyes :D
Tough to find positives 'here' right now, but I think I managed it a little. Thanks for stopping by!
I'm happy to see https://musing.io representing. Thanks for the graphics, makes data assimilation easy for the lazy like me :D
I tried to keep it simple - it's in my nature :) Glad you enjoyed the visuals :) And well done Musing!
Keeping it stupidly simple (K.I.S.S) wins again :)
Man, that’s some major details! Thanks for supplying this! 😀
Posted using Partiko iOS
No worries, what else do I want to spend 10 hours doing!? :D
This awesome. Thanks for this!
Posted using Partiko iOS
Thank you, and thanks again for the resteem! :D
It's because we are all playing Steem Monsters and I refuse to accept any other reality! Hands twitches I I I got go play another round.
Yep. I'm almost at 1000 - it's taken a while!
Scoots off for 'just one more game'....