Steemit Follower Bubbles - Open Source Project with D3 Circle Packing
Show steemit followers in a D3 circle chart, with a circle size depending on the vesting shares. The technique is called "circle packing".
Repository
https://github.com/ateufel/steemit-bubbles
What is the project about?
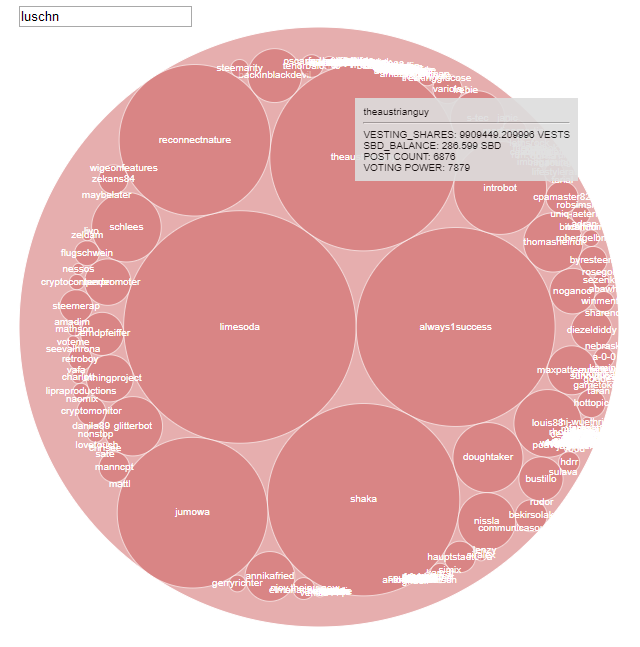
Choose a Steemit username in the input field and hit "ENTER" to see all your followers in a D3 circle chart. The technique to put all circles in a big circle with a specific size and organize them by some value is called "circle packing". In this case, the value that changes circle sizes is the "vesting_shares" field of the followers.
If you hover over one circle, you will see a tooltip with additional info about the user. If you click on the circle, the Steemit URL of the user will open in a new tab/window.
The code is very well documented and should explain how to use circle packing with the latest D3 version. It also includes functionality to load Steemit followers with the dsteem library, and - for later additions - a function to load the users you follow as well.
Usage
yarn installto install all the neccessary packagesyarn run devto start the development environment with webpack-dev-serveryarn run buildto build the project
Technology Stack
The project uses the latest versions (as of now) of the following stack:
Future Plans / Roadmap
The main goal of the project was to get the followers and to show them in a packed circle chart, because it makes sense to see who your most powerful followers are. There is still room for improvement though (isn´t there always?), here is my list of planned tasks/ideas for the future:
- show a nice loader animation (in css or svg only) for the api call waiting time
- improve circle view (username lables don´t really work right now) or only show top followers
- improve styling (input field, tooltip)
- calculate reputation and steem power from existing values
- let users switch between followers and following
- let users choose different values for the circle size (reputation, sbd_balance, ...)
- maybe switch to react and ant design
You can find the list in the README of the repository.
How to contribute
As usual, create an Issue on Github or drop a comment if you want to contribute in any way. Or send me a Pull Request if you want to help improve the code or implement some new feature.
My Github Account: https://github.com/ateufel
Here´s an example how that looks like:
Small concept but I like the idea of using d3 packed bubbles to visualize data.
Yeah, circle packing was the hardest part of it, never used D3 before and there is so much example code for very old D3 versions out there :) - and i forgot one future task that would be nice: animating the chart when you switch to another user or another value for the circle sizing.
btw, thanx for "hodl the coin" bug hunting, you will definitely be mentioned when we release the next version. i hope you will test it again :)
Thank you for your contribution. Though it's not unique, I really liked the presentation, hopefully, you can add more features to this to make it unique.
Your contribution has been evaluated according to Utopian policies and guidelines, as well as a predefined set of questions pertaining to the category.
Need help? Write a ticket on https://support.utopian.io/.
Chat with us on Discord.
[utopian-moderator]
Hey @luschn
Thanks for contributing on Utopian.
We’re already looking forward to your next contribution!
Contributing on Utopian
Learn how to contribute on our website or by watching this tutorial on Youtube.
Want to chat? Join us on Discord https://discord.gg/h52nFrV.
Vote for Utopian Witness!