An infection ranking method tested on a steem network game
Repository
https://github.com/mathowl/Kingofdisease
Introduction
Image from the king of disease post
King of disease is an April Fool's joke game created by @suesa and @reggaemuffin . The aim of the game is to spread the king of disease virus to as many accounts as possible. Once a user has been infected that user can spread the disease to other accounts by replying to their post with !sneeze. Users cannot be cured, hence, they cannot catch the virus twice.
The setting of the game is similar to a networking problem. Typically, for these problems it is interesting to distill observations in as few parameters as possible since this reduces its complexity. This then allows you to perform a simple predictive analysis. Furthermore, from the virus perspective you would want to know which user is the most promising virus carrier. Similarly, from the human perspective you would want to know who to quarantine.
In this post we will define a single value called the infection index which rank the users by how good they are at spreading the virus. We also perform a predictive analysis on the infection index using standard non-linear regression.
What does the virus want?
The virus wants to spread itself to as many users as possible. Of course spreading to users who do not spread the disease is less favorable than spreading to users which spread the disease. The point system of the king of disease game, as formulated in here, is based on how many of the users which have been infected directly or indirectly by a single users have spread the disease. So the closer to the first infection the more likely that the user has higher points. From a virus prioritization perspective it is not clear if it would have been more effective to infect certain users away from the first infection. The aim is to define a better ranking for the virus.
Total points, Direct points and Points
To define the ranking we are restricted to using the available data from King of disease. Per user there are three values available: Total points, Points and Direct points. Total points of a virus carrier A are the total users directly or indirectly infected by A. Direct points of A are the users which were directly infected by A. Points of A are the Total points of A minus the users that were directly or indirectly infected by A but did not spread the virus. Points are used as ranking method in the King of disease game since Total points and Direct points could be high as a result of spamming.
Data
Using the BeautifulSoup package the data could be easily extracted to workable python format. Columns with zeros are not interesting, they have been removed.
Infection index
Points of a carrier A can be high if A infected an effective carrier. Hence, it does not necessarily measure the effectiveness of A. So it makes sense to multiply Point by some value which measures effectiveness. We introduce the Infection index:
Infection index = Points x Direct Points / Total points
Infection index graph and non-linear regression
From the available data we can compute the Infection index for each user. But of course we then need to sort the users such that the Infection index is descending with respect to the users, see the red dots below
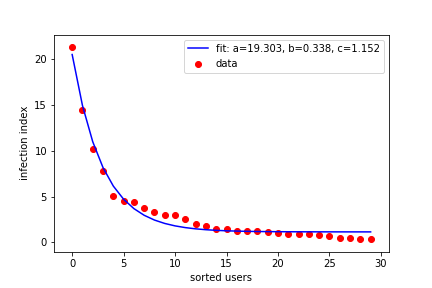
Surprisingly, we can find an excellent least squares fit of the data with the function: a*(exp(-b*x))+c. For a visual depiction and parameter values see the blue curve above.
Infection index versus Total Points, Direct Points, Points
The Infection index gives a nice ranking but is it any different from the ranking given by Total points, Direct points, Points? Yes:
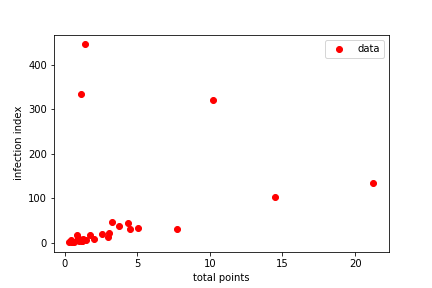
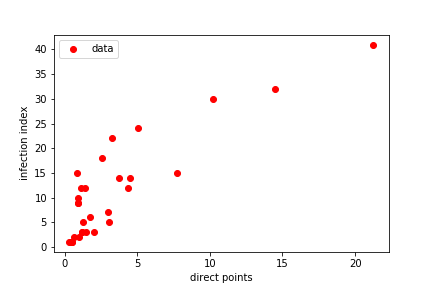
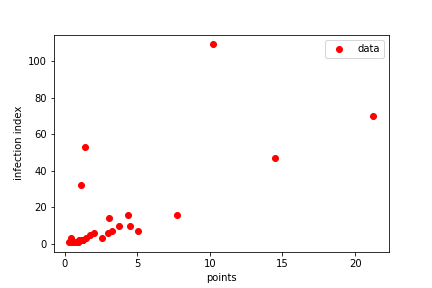
If the ranking would be the same then the data in the above plot would be ascending. This is clearly not the case. However, there seems to be some local ascending ordering present. This seems to be specifically the case for large Direct point values.
Conclusion
The infection index gives a ranking method which takes into account the effectivity of a carrier in spreading the virus. Based on the available data the infection index is different from Total Points, Direct Points, Points. The infection index uses both values related to direct and indirect virus spreading so it reduces the complexity.
Finally, some concluding remarks:
- The useful data set, which are data values without zeros, was quite small. It only contains 30 elements
- In a theoretical or experimental setting you could actively remove carriers with a high infection index and then compare the infection spreading to a setting where no users are removed. You could also measure fluctuations in the infection index and see if you can reduce the speed with which the infection spreads.
Proof of authorship
https://github.com/mathowl/Kingofdisease/blob/master/steem_virus.ipynb
Hey @mathowl,
nice stuff and very understandable written. The problem of computer viruses is something I often think about. Nice would be a historical overview when it starts, why and the technical basics.
Concerning the Index. I can see the higher the index is the more difficult it is to find the exact points. Only little indices (lower 20) are good indicators. Did I get this right?
Bytheway: The picture above shows a bacteriophagy which mainly infects bacteria ;-)
source: pixabay.
Have a nice weekend
Chapper
Thanks for the read chappetron. Actually I am not familiar with the history of this type of modelling haha maybe something for another post.
I am not sure I understand your question which graph are you referring to?
PS nice image :o) The top image in my post comes from the game :P
Posted using Partiko Android
I mean this one here
Regards
Chapper
When looking for a linear relation there has to be some apriori reason as to why this is the case. I would not expect there to be linear relation between the total points and the infection index since the formula for the infection index does not suggest there to be a linear relation. The infection index is determined from total points, points and direct points.
The plot in itself seems to suggest that there is some kind of linear relation for small total points but this might just be the case because they are all hudled together.
The above scatter plot is mainly to show that the ordering for the infection index is different from the ordering given by total points. The fact there there are outliers indicate that both of them are different.
For the infection index versus sorted user plot there is some apriori evidence that an exponential function would be good fit. We are dealing here with some kind of skill distribution on a population so then an exponential distribution is not that strange.
Congratulations! This post has been upvoted from the communal account, @minnowsupport, by mathowl from the Minnow Support Project. It's a witness project run by aggroed, ausbitbank, teamsteem, someguy123, neoxian, followbtcnews, and netuoso. The goal is to help Steemit grow by supporting Minnows. Please find us at the Peace, Abundance, and Liberty Network (PALnet) Discord Channel. It's a completely public and open space to all members of the Steemit community who voluntarily choose to be there.
If you would like to delegate to the Minnow Support Project you can do so by clicking on the following links: 50SP, 100SP, 250SP, 500SP, 1000SP, 5000SP.
Be sure to leave at least 50SP undelegated on your account.
This post has been voted on by the SteemSTEM curation team and voting trail. It is elligible for support from @utopian-io.
If you appreciate the work we are doing, then consider supporting our witness stem.witness. Additional witness support to the utopian-io witness would be appreciated as well.
For additional information please join us on the SteemSTEM discord and to get to know the rest of the community!
Thanks for having added @steemstem as a beneficiary to your post. This granted you a stronger support from SteemSTEM.
Please consider using the steemstem.io app to get a stronger support.
Hi @mathowl!
Your post was upvoted by Utopian.io in cooperation with @steemstem - supporting knowledge, innovation and technological advancement on the Steem Blockchain.
Contribute to Open Source with utopian.io
Learn how to contribute on our website and join the new open source economy.
Want to chat? Join the Utopian Community on Discord https://discord.gg/h52nFrV