Web Dev tutorial: Creating a beautiful choropleth map that plots European GDP on a Mapbox map using Leaflet and GeoJSON
https://github.com/Leaflet/Leaflet
Creating a choropleth map of European GDP using Leaflet.js and Mapbox
In this tutorial I will show you how to make a choropleth map that plots the Gross Domestic Product of every country in Europe. The project will be written in Javascript using the Leaflet.js library, a Mapbox map, and data in GeoJSON format containing economic information. Check out the finished project here.
What you will learn:
- What a choropleth map is
- What GeoJSON is
- Using a Mapbox map in a project
- Creating a choropleth map with Leaflet.js
Requirements:
- Leaflet.js
- Mapbox
- GeoJSON data containing data about Euorpean GDP
Difficulty:
IntermediateWhat is a choropleth map?
Before we get started, let’s explain what a choropleth map is to those who might not know. A choropleth map is a map that displays quantitative data values using a range of colors. Or, as more eloquently put by Wikipedia:
A choropleth map (from Greek χῶρος ("area/region") + πλῆθος ("multitude")) is a thematic map in which areas are shaded or patterned proportionally to the value of a particular variable measured for each area. Most often the variable is quantitative, with a color associated with an attribute value. Though not as common, it is possible to create a choropleth map with nominal data. Choropleth maps illustrate the value of a variable across the landscape with color that changes across the landscape within a particular geographic area. [1] A choropleth map is an excellent way to visualize how a measurement varies across a geographic area.
What is geoJSON?
Simply put GeoJSON is a format for passing JSON data that also contains geographic coordinates. Learning all the ins and outs of GeoJSON would warrant a tutorial of it’s own. Check out geojson.org if you’re interested in the checking out the GeoJSON standards. The documentation is long and dry and a complete understanding of this format is not required to make a cool map with it using Leaflet and Mapbox.
The example block of GeoJSON data from the site does a good job at illustrating the differences between regular JSON and GeoJSON:
{
  "type": "Feature",
  "geometry": {
    "type": "Point",
    "coordinates": [125.6, 10.1]
  },
  "properties": {
    "name": "Dinagat Islands"
  }
}
As you can see GeoJSON data includes things like points and geographic coordinates for creating maps.
Now that we have an understanding of the GeoJSON format let’s move on to the project itself.
The finished project
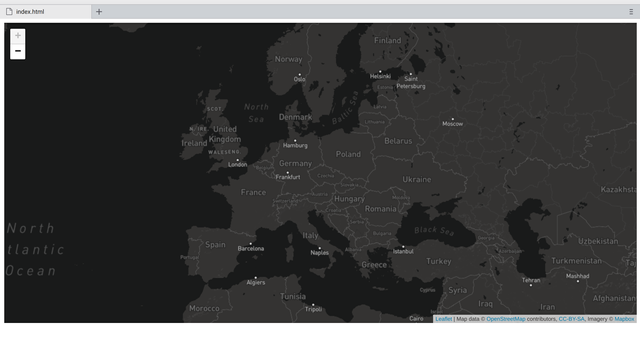
For this project we will be using Mapbox’s dark world map. I’m partial to darker colored maps but the same project could easily be made with any of the other Mapbox maps. Changing the map style is as simple as swapping out the URL and changing one line of code.
In the head of our index.html file we will need to load some scripts to work with Leaflet.js, the data file, and Google fonts:
  <head>
    <meta charset="utf-8">
    <title></title>

    <link rel="stylesheet" href="https://unpkg.com/[email protected]/dist/leaflet.css"   integrity="sha512-Rksm5RenBEKSKFjgI3a41vrjkw4EVPlJ3+OiI65vTjIdo9brlAacEuKOiQ5OFh7cOI1bkDwLqdLw3Zg0cRJAAQ=="
  crossorigin=""/>

  <script src="https://unpkg.com/[email protected]/dist/leaflet.js"
  integrity="sha512-/Nsx9X4HebavoBvEBuyp3I7od5tA0UzAxs+j83KgC8PU0kgB4XiK4Lfe4y4cgBtaRJQEIFCW+oC506aPT2L1zw=="
  crossorigin=""></script>

    <script src="europe.js"></script>

    <link href="https://fonts.googleapis.com/css?family=Playfair+Display+SC|Roboto" rel="stylesheet">

  </head>
The GeoJSON data that provides us with the geographic coordinates as well as the economic data can be found here.
After downloading the GeoJSON save the file so that it has a .js extension. Save it as europe.js. We can now use <script src="europe.js"></script> to load the file into our index.html document. This give us access to the data.
Next, in the body our index.html, make an HTML element with the “mapid”. This will store our map in an HTML element so it can be displayed:
<div id="mapid"></div>
Next we will declare some variables that will be used later on:
    var geojson;

    // Lat/Long for Prague
    var lat = 50.0755381;
    var long = 14.43780049999998;
geojson will be used later in the program. The lat and long variables store the geographic coordinates for Prague. We need a way to center our map around Europe and being that Prague is close to the center of the continent we can pass these coordinates to the following function to center the map on Europe:
var mymap = L.map('mapid').setView([lat, long], 13);
The ‘L’ in this line of code references the Leaflet object. Throughout the program when using Leaflet’s built-in functions the ‘L’ object is called. You’ll see this convention throughout the project when calling Leaflet functions.
The previous line of code creates a mymap variable that stores a Leaflet map and displays it in the mapid HTML element. The Leaflet setView function is called. We pass the lat and long variables to this function to set the map’s view centered on Prague. The second parameter passed to setView is the number 13. This number specifies how zoomed in the map should be. The initial zoom level of the map can be adjusted by changing this number.
In order to display the Mapbox map we need to use the following block of code:
L.tileLayer(' https://api.mapbox.com/styles/v1/mapbox/dark-v9/tiles/256/{z}/{x}/{y}?access_token=pk.eyJ1Ijoibmlja255ciIsImEiOiJjajduNGptZWQxZml2MndvNjk4eGtwbDRkIn0.L0aWwfHlFJVGa-WOj7EHaA', {
attribution: 'Map data © <a href="https://www.openstreetmap.org/">OpenStreetMap</a> contributors, <a href="https://creativecommons.org/licenses/by-sa/2.0/">CC-BY-SA</a>, Imagery © <a href="https://www.mapbox.com/">Mapbox</a>',
maxZoom: 4,
minZoom: 3,
id: 'mapbox.dark'
}).addTo(mymap);
Leaflet’s tileLayer function is used to set the tiles of the map. The Mapbox dark map’s URL Mapbox gave us and the id: ‘mapbox.dark’ is passed to this function to load the map we want. If we wished to use a different Mapbox map all we would need to do is switch the URL and the id to the appropriate map and our map would change to the new map.
Also passed to this function are the maxZoom and minZoom properties which are self explanatory. Increment/decrement these values and the zoom levels can be adjusted.
Finally, we call addTo and pass it the mymap variable we created earlier. Open the index.html file in the browser and you should see the Mapbox dark map load up.
Next let’s go over the various functions used in this project and give a basic rundown of what they do:
Leaflet functions used:
The functions we will make:
| Function | Does |
|---|---|
| getColor() | Determines color based on GDP data input |
| style() | Applies styles to our map, is passed color from getColor() |
| highlight() | Handles what the map should do on hover |
| reset() | Resets the hover, handles what to do when mouseover is false |
| zoomToCountry() | Zooms in on country that is clicked |
| onEachFeature() | Applies highlight(), reset(), and zoomToControl to the map layer |
| Anonymous function set to legend | Creates map legend |
| Anonymous function set to displayInfo | Creates custom hover element that displays data |
getColor()
  function getColor(d) {
      return d > 1000000 ? '#005824' :
          d > 500000  ? '#238b45' :
          d > 200000  ? '#41ae76' :
          d > 100000  ? '#66c2a4' :
          d > 50000   ? '#99d8c9' :
          d > 20000   ? '#ccece6' :
          d > 15000   ? '#edf8fb':
                            'snow'
    }
The getColor() function will use a ternary operator and CSS hex color codes to determine what color to color each country. Later we will pass getColor() the data from the API pertaining to national GDP, which is provided by the GeoJSON data in the property gdp_md_est. Then getColor() will use the ternary operator to determine how to color each country depending on GDP in thousands of millions of dollars. For example, countries with a GDP of over 1000000 million (or 1 trillion) dollars will be colored the darkest green (#005824).
style()
function style(feature) {
      return {
          fillColor: getColor(feature.properties.gdp_md_est),
          weight: 1,
          opacity: 1,
          color: 'snow',
          fillOpacity: .7
      };
    }
The style() function does exactly what it sounds like it does, it returns an object of styles we are applying to the map. fillColor is set to the getColor() function and passes it the GDP data from the API. Opacity and color set the color of the borders of the country. Weight sets the thickness of the national borders.
highlight()
The next function, hightlight() handles what to do when the user hovers over a particular country with their mouse:
function highlight(e) {
      var layer = e.target;

      layer.setStyle({
          weight: 3,
          color: '#ffd32a',
      });

      if (!L.Browser.ie && !L.Browser.opera && !L.Browser.edge) {
          layer.bringToFront();
      }

      displayInfo.update(layer.feature.properties);
    }
We pass the function a parameter, e, and set the variable layer equal to e.target. This grabs the element the user is hovering over. Next, we set the style of the hovered element using the setStyle method. We pass setStyle the properties for the weight of the hovered element’s border and it’s color. This creates a visually appealing and thick gold border for the element currently being hovered over by the user’s mouse.
The following if statement is a workaround for a common browser bug when displaying Leaflet layers in Internet Explorer, Opera, and Microsoft Edge browsers.
Finally, we call the update method on displayInfo. The displayInfo variable will be created later on in our program and will handle the HTML elements that will display information about the hovered upon country in the top right of our map. The update function is called on it here and passed layer.feature.properties so that the displayInfo element is updated with the appropriate data.
reset()
The next function, reset() simply resets the styles when the user stops hovering on a particular country (mouseout event):
    function reset(e) {
      geojson.resetStyle(e.target);
      displayInfo.update();
    }
The resetStyle method is called on geojson and resets the style of e.target, or in other words, the targeted element that is no longer being hovered over by the user. After that we update displayInfo again so the styles are reset.
zoomToCountry()
function zoomToCountry(e) {
      mymap.fitBounds(e.target.getBounds());
    }
zoomToCountry calls the fitBounds method on our map and passes it e.target and the getBounds method. This zooms in on whichever country the user clicks.
onEachFeature()
function onEachFeature(feature, layer) {
      layer.on({
          mouseover: highlight,
          mouseout: reset,
          click: zoomToCountry
      });
    }
The next function, onEachFeature() calls the on method on layer and sets mouseover, mouseout, and click to the appropriate functions we have created for those events.
In order to call all of these functions and apply our JSON data to the map and successfully plot the colors and information we need to use Leaflet’s geoJson method.
Adding our functions and data to the map using .geoJson()
  geojson = L.geoJson(countriesData, {
        style: style,
        onEachFeature: onEachFeature
    }).addTo(mymap);
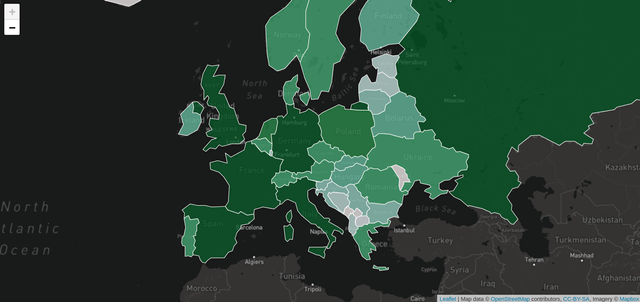
If you’re following along and open the project at this point you’ll see the map and the European countries properly colored in a choropleth fashion. The project should look something like this:
The next step is to add legends to our map. Two legends will be added; one legend that displays data about the hovered upon country in the top right of the map, and a second legend that will display the colors used on the map and their quantitative values on the bottom right of the map.
Adding legends using L.control
In order to create our legend we will create a variable, legend and set it equal to an instance of L.control.
  // Legend
    var legend = L.control({
      position: 'bottomright'
      }
    );
We pass L.control one key value pair setting the position: to bottomright. You guessed it, this puts the legend we are creating on the bottom right of the map.
Our full legend element looks like this:
legend.onAdd = function (map) {
var div = L.DomUtil.create('div', 'info legend'),
colors = [15000, 20000, 50000, 100000, 200000, 500000, 1000000],
labels = [];
div.innerHTML += '<h4>GDP in Thousands of Millions of USD</h4>';
// Loops through GDP data and grabs colors for each range and puts them in the legend’s key
for (var i = 0; i < colors.length; i++) {
div.innerHTML +=
'<i style="background:' + getColor(colors[i] + 1) + '"></i>' +
colors[i] + (colors[i + 1] ? '–' + colors[i + 1] + '<br>' : '+');
}
return div;
};
legend.addTo(mymap);
The onAdd method is called on legend and we define what we want to happen when the element is created.
The div variable calls Lealeft’s DomUntil.create method and creates an HTML div with classes of info and legend. Two arrays are created. The colors array stores the same GDP values we used in getColor(). The second array, labels creates a place for us to store the keys used in the legend.
Next, we use div.innerHTML to create an h4 element to display the title of our legend.
The final step in creating our legend is to use a for loop to loop through the colors array, grab each value, and display it next to an icon with the appropriate choropleth color being mapped for that numerical value.
To display the legend on the map we call the addTo method on legend and pass it the parameter containing the HTML element we created for our map (mymap).
The last piece of code we need to write for our map is the custom legend that will display GDP and population data from the geoJson file and display it in a box on the top right of our map when a European country is hovered over.
The code for this legend is very similar to the previous legend we created.
  // On hover control that displays information about hovered upon country
    var displayInfo = L.control();

    displayInfo.onAdd = function (map) {
        this._div = L.DomUtil.create('div', 'info'); // create a div with a class "info"
        this.update();
        return this._div;
    };
A variable, displayInfo is created and set equal to L.control in the same manner as the first legend we created. Once again we call the onAdd method and create a function that uses L.DomUntil.create to create and return an HTML element that will store our custom legend.
After this HTML element is created the update method is called. This function tells the map what to do when the user hovers.
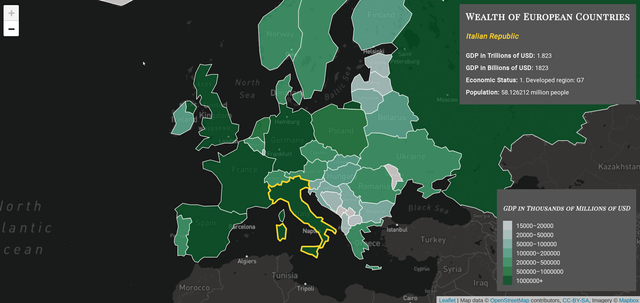
// Passes properties of hovered upon country and displays it in the control
    displayInfo.update = function (props) {

        this._div.innerHTML = '<h2>Wealth of European Countries</h2>' +  (props ?
            '<h3>' + props.formal_en + '</h3>' + '<b>' +  'GDP in Trillions of USD: ' + '</b>' + props.gdp_md_est /1000000 + '<br />'
            +'<b>' + ' GDP in Billions of USD: ' + '</b>' + props.gdp_md_est / 1000 + '<br />'
            + '<b>' + 'Economic Status: ' + '</b>' + props.economy + '<br />'
            + '<b>' + 'Population: ' + '</b>' + props.pop_est /1000000 + ' million people'
            : 'Hover over a European country');
    };

    displayInfo.addTo(mymap);
Inside this function we create an HTML element with this._div.innerHTML and inside of that an h2 is created for the title, and sections displaying GDP, economic status, and population for each country. Each of these elements is passed the appropriate data from the geoJson file via props.gdp_md_est, props.economy, and props.pop_est. In the case of props.pop_est we divide it by 1000000 so that the number is displayed in millions.
This concludes the custom legend. But how does the legend know when to update on hover?
If you remember earlier we passed the displayInfo variable to both the highlight() and reset() functions like so:
  // Happens on mouse hover
    function highlight(e) {
      var layer = e.target;

      layer.setStyle({
          weight: 3,
          color: '#ffd32a'
      });

      if (!L.Browser.ie && !L.Browser.opera && !L.Browser.edge) {
          layer.bringToFront();
      }

      // Updates custom legend on hover
      displayInfo.update(layer.feature.properties);
    }

    // Happens on mouse out
    function reset(e) {
      geojson.resetStyle(e.target);
      // Resets custom legend when user unhovers
      displayInfo.update();
    }
This allows the anonymous funtion passed to displayInfo to update and reset when the user hovers and unhovers on a particular country.
The map is done!
Our choropleth map is now complete. In this tutorial we learned about the basics of choropleth maps, the GeoJSON format itself, working with Mapbox maps, many Leaflet functions, and how legends are created.

I hope the tutorial was clear and concise and that you learned how to get started with making choropleth maps with Leaflet. For the sake of clarity the CSS used to style the legends was not included in this post but can be found in the Github repo and is self-explanatory.
Feel free to ask questions if something is unclear or you get stuck.
Useful resources:
Working with Mapbox itself can be tricky. Check out the Mapbox documentation if you get stuck.
The Leaflet.js documentation is very clear and thorough.
The project in it’s entirety, including the GeoJSON file containing the economic data used for this project, can be found in the Github repo.
Thank you for your contribution.
While I liked the content of your contribution, I would still like to extend few advices for your upcoming contributions:
Looking forward to your upcoming tutorials.
Your contribution has been evaluated according to Utopian policies and guidelines, as well as a predefined set of questions pertaining to the category.
To view those questions and the relevant answers related to your post, click here.
Need help? Write a ticket on https://support.utopian.io/.
Chat with us on Discord.
[utopian-moderator]
Hi @nicknyr, I'll follow and upvote you because this is great quality and you put a lot of effort into your post. Not that I'm going going to make a colour coded map anytime soon😸
Haha thanks. I'm glad the crypticat is pleased.
Hey @nicknyr
Thanks for contributing on Utopian.
We’re already looking forward to your next contribution!
Contributing on Utopian
Learn how to contribute on our website or by watching this tutorial on Youtube.
Want to chat? Join us on Discord https://discord.gg/h52nFrV.
Vote for Utopian Witness!
Thank you for this! I couldn't figure out how to build a map like this and what tools to use, and this tutorial took me step by step with everything. I've built this map based on this post: https://mackuba.eu/corona/#map.daily