STEEM ANALYZE SUPPORT AND RESISTANT AND BUY OPPORTUNITIES ON 15 MINUTES ONE HOUR 4 HOUR AND ONE DAILY TIME FRAME
Assalamu Alaikum friends hope you are all well. We are here to share and analyze some of our favorite tokens. We will get an idea about the price of the shop through technical analysis. I will try to determine the price of the token with some important indicators. So let's start.
We can determine the price of various tokens through candlestick analysis. Of course, candlestick patterns sometimes don't work properly when fundamentally changing. The same thing happens when the volume increases and the funds are pumped in. But we should always enter and exit the market through candlestick analysis. Then our fund will be fine.
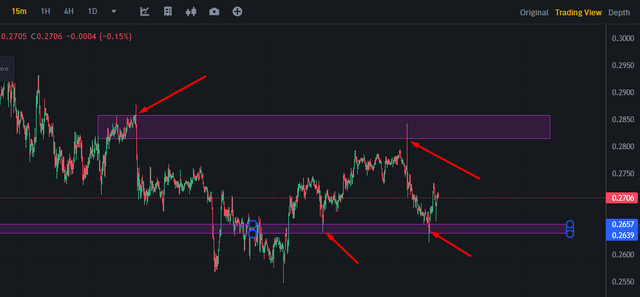
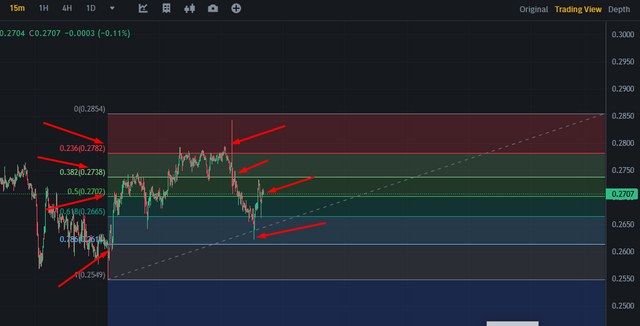
I first analyze the 15-minute candlesticks. Here you can see the Fibonacci retracement level indicator with support and resistance. I analyzed the candlesticks and found that 0.5 is a support and 0.236 is a resistor.
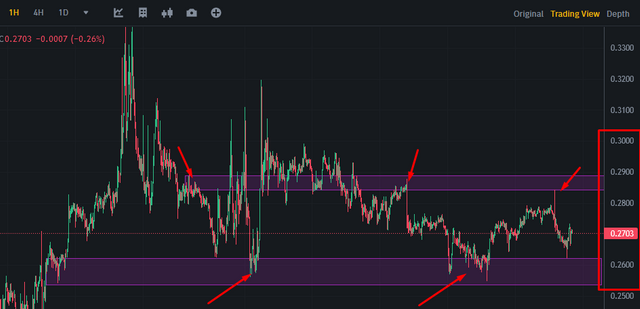
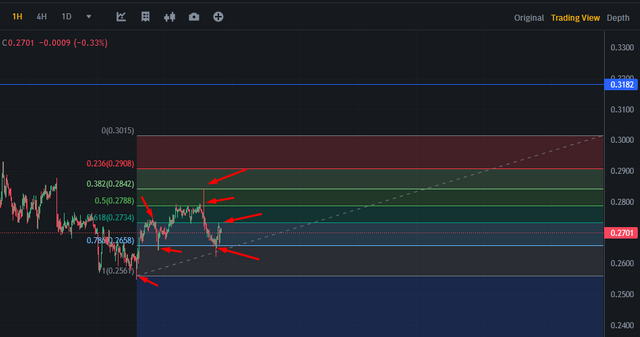
Analyzing the one-hour candlestick pattern, I can see what I have shown you in the screenshot. Here it is clear that we see a good support at 0.26 cents and draw it. As resistance we can see the candlesticks indicating 0.29 send.
By drawing the Fivonaci retest levels we can see that the zero points 26 and 0.29 indicate the same. 0.5 and 0.786 are showing the same way. The prizes are accurately indicating my drawn patterns and Fivonaci retracement levels.
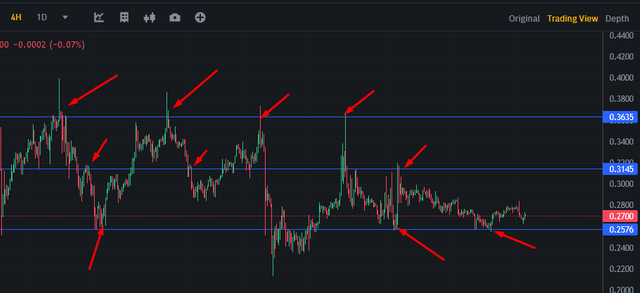
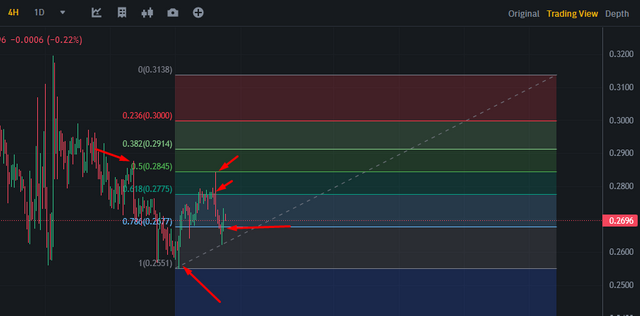
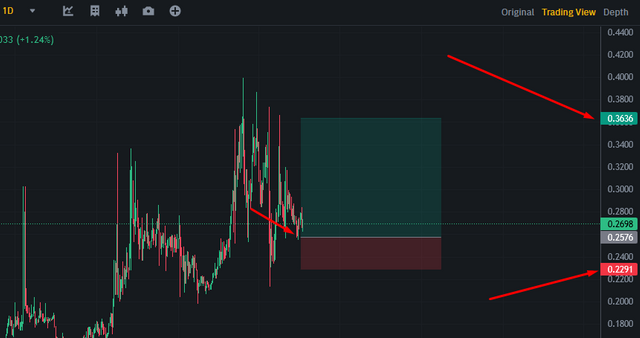
I saw the indicators in the 4 hour time frame and drew. The largest resistor at the top is 0.36 cents. Then there is resistance at 0.3145. 26 is also working here as support. The candlesticks are respecting the support of 0.26 very nicely.
Setting the Fivonaci retest level indicator shows that zero point five has taken the 0.2750 resistance in the four hour time frame. We see two resistors here 0.618 and 0.5. Here prices are acting as support and registered which is 0.2650 acting as support and 0.28 resistance is seen at 0.618 and 0.5.
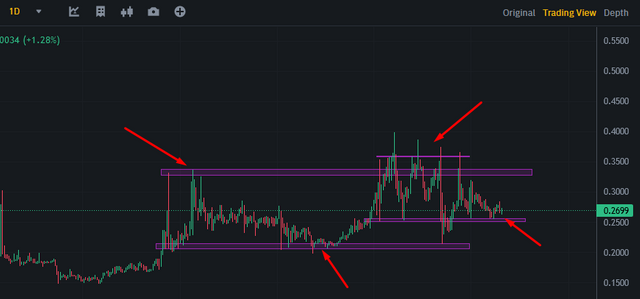
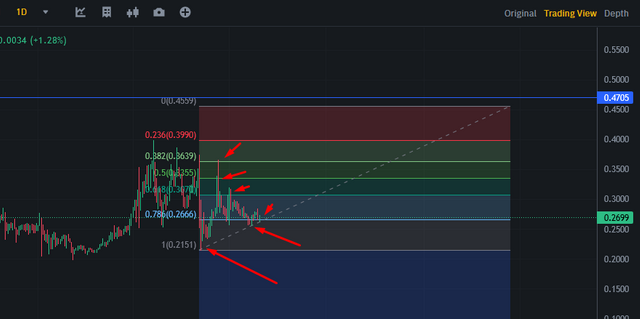
I have drawn here the one day support and resistance through the oriental line and drawn the Fibonacci replacement level. 0.382, 0.5, 0.648 fivonaci replacement level draw here we see these three are acting as resistance and our support is 0.786.
If you look at the candle stories, you will definitely understand that the horizontal lines I have drawn indicate the fivonaci retest level. 0.26 is acting as our support and 0.30, 0.34, 0.38 are acting as big resistors which are repeatedly hitting the candlesticks and coming back down. For a long time these genderist have been big registant and strong.
We analyzed all the candlesticks and found out that we can buy the token at 0.2550 or 0.26 and hold for long which we will sell later with a target of 0.35, 0.36. I'm ending here wishing everyone good health, may God bless you today.

SET @rme as your proxy

X promotion link
https://x.com/mostofajaman55/status/1792498533230116908