Programming Diary #14: Historical graphing and helpful descriptions
Summary
Another fortnight, another programming update. In the past two weeks, I focused almost exclusively on the toy Java Steemometer program, but I also branched into python to implement a fix for @cmp2020's @mod-bot program. Continuing my practice from the last several months, this post will describe my activities during the two weeks since I posted, Programming Diary #13: Recovering from a git blunder & setting the stage for more context. According to bitbucket and github, I made 8 commits in the Steemometer repo and 3 commits in the @modbot repo. Let's talk about the activities.
Background
Reintroducing @mod-bot
Before discussing my goals and activities, let me reintroduce @mod-bot. This account is backed by a python program that @cmp2020 wrote a little over a year ago. The idea here was to let communities automate some basic admin activities such as pinning and muting posts based on certain criteria (such as @null beneficiary settings or post promotion through @null transfers).
As with so many other activities, progress is slow/stalled because of time constraints (@cmp2020 has been carrying more than 20 credits per semester due to his double-major in comp. sci & music theory/composition), but I really think that the idea has promise if it can ever receive the TLC that it deserves. For example, this type of capability could be used to implement features that we find in other social media services such as verification, membership services, and sponsored posts.
We have been running @mod-bot in the Popular STEM community since September of 2022 in order to automatically pin (and unpin when expired) posts that are set with @null beneficiary settings or promoted with transfers to the @null account. Unfortunately, I noticed recently that the auto-pinning capability had stopped working.
Goals from the last cycle
Now, with that out of the way, let me also restate my goals from my last diary post. Here they were:
- Enable clicking on the speedometer instrument portion of the display to switch to a new visualization that will eventually show 5 minutes of data in an Area Chart and clicking back from the new visual. (Note that I'm not necessarily going to start populating the new visual with data. The only 2-week goal is to create it.)
- Let the user "mouse over" the VAAS area of the display and somehow see what URL it is pointing to.
For (I think) the fourth cycle in a row, I managed to accomplish both goals and also made additional progress, as described below.
Progress
Previous goals
Toggling visualizations
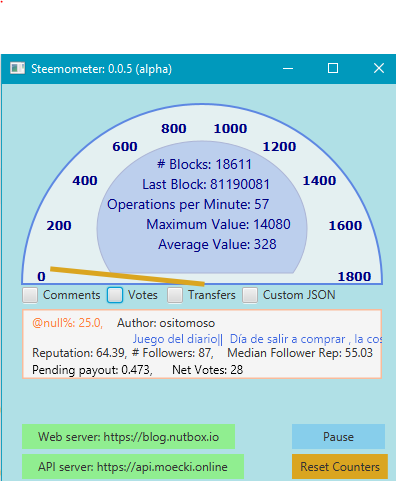
The first goal was to enable switch between the speedometer style gauge which already existed to a new blank panel that would eventually hold an historical graph of blockchain activity. Not only did I accomplish this, but I also created a JavaFX AreaChart object that is actually displaying the historical data. It displays the average numbers of operations from the last 20 blocks (one minute) and maintains 100 blocks (5 minutes) worth of history. (Here's what it looks like:
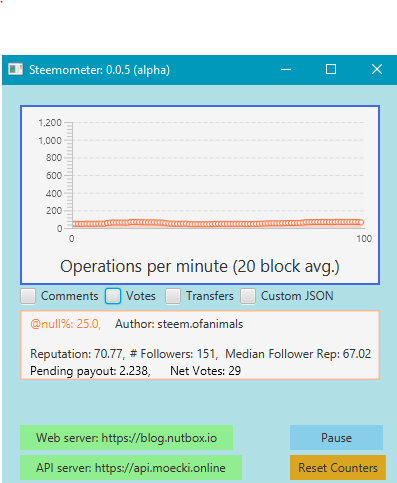
I really didn't expect to be able to get this far in two weeks, so I'm pleased with this result. And of course, if I click on it again, it goes back to the original display.
In the course of creating this graph, I noticed a problem with the queue that I created during the previous cycle. The numbers were being displayed from the front of the queue, instead of the back, which meant that the graph took 5 minutes to get past the first minute of data. Therefore, I modified the graph to display from the back of the queue, which means that the data is always updating.
There still seems to be a problem, however, as the numbers sometimes appear to be implausibly low, so I'll need to revisit that logic.
Display URL on mouseover
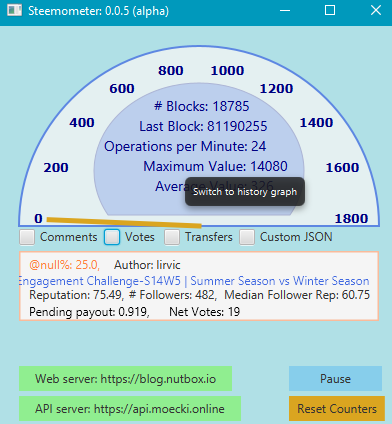
The second goal was to let the user see the URL before clicking in the clickable VAAS area, where user posts are displayed. This was accomplished using Java's Tooltip functionality, and it looks like this:
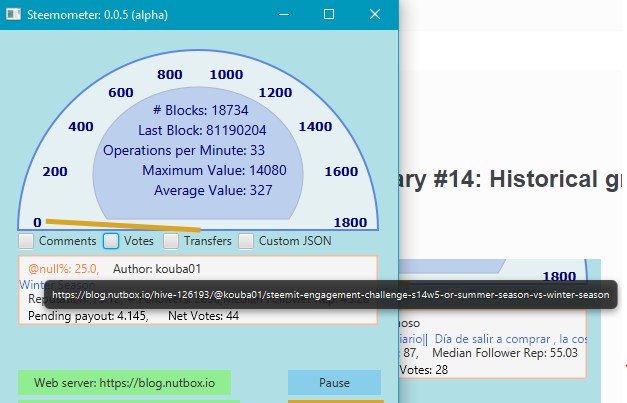
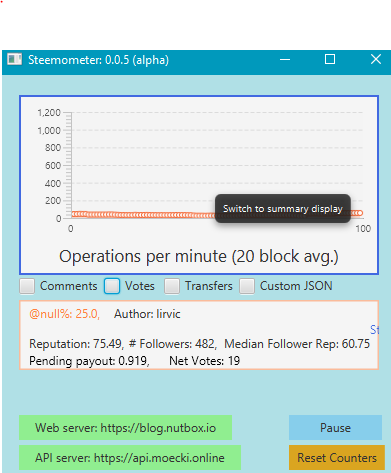
And having learned (from ChatGPT) how to implement a Tooltip, I also added Tooltips over the visualizations in the upper section of the window.
|
|
|
Unexpected python coding
Recently, @o1eh has been posting some interesting archaeological posts in the Popular STEM community. If you haven't read them, I recommend that you do. I happened to notice, however, that even though they had the @null beneficiary set to 25%, @mod-bot was not auto-pinning the posts. It had been some time since I looked at this code, so it took me a while to come up to speed and troubleshoot it. Eventually, I think I managed to find and fix the problem (it turns out that the JSON ordering from here seems to have changed. Author and permlink were hardcoded with fields 18 & 19, but now those fields are listed as 6 and 7... TO-DO: pull field ordering from the URL, itself, instead of using hardcoding.), and the auto-pinning seems to be working properly.
Netbeans updated
As noted in my previous post, Netbeans version 20 was released, so I updated my IDE and imported all of the necessary plugins. I also tested that the JavaFX SceneBuilder is working in the updated version, although I'm not actually using that yet.
Next up
In keeping with past practices, I'll define two goals for the coming fortnight. This time, the focus is shifting back to the Visibility as a Service (VAAS) display in the middle section of the window.
The new goals are:
- Create minimum value filters for posts that appear in the VAAS section of the display based on at least these criteria: 1.) author reputation; 2.) number of followers; 3.) median reputation of followers.
- Offer suggested voting percentages for posts that appear in the VAAS section based on the same criteria, as well as other criteria like the number of words and the current payout value.
As a stretch goal, if time allows - I also want to see if I can validate the numbers and determine whether the implausibly numbers that are making me suspicious really do represent a problem.
Additionally, I'm not going to copy them forward, but my other plans for the application were listed in my previous programming diary post, and have not changed.
Reflections
In line with my goals for the next fortnight, I want to talk about using follower metrics as one indicator of post quality. As described in Programming Diary #11, I included three fields of author information in the VAAS portion of the display, author reputation, number of followers, and median follower reputation. Now, having looked at test output during the subsequent 6 weeks, I think that those fields actually convey some useful information, and in general it might be useful for curators to include them in our decision making.
These are the kinds of things that I'll be thinking about, both for auto-moderation of the VAAS section and for the suggested voting percentages.
Author reputation
It has been widely argued that author reputation may not be a great indicator for content quality. Reputation goes up when an upvote is received, so someone using a bot service to upvote SPAM can actually increase their reputation score faster and more effectively than someone who takes the time to compose a thoughtful post.
What author reputation does indicate fairly reliably, though, is the likelihood that a particular post will receive a sizeable upvote. So, all else being equal a voter who wants to earn higher curation rewards should allocate more voting power for a high reputation author than for a low reputation author.
Number of followers
Something that always catches my attention is the combination of a high author reputation and a low number of followers. It's not impossible for this combination to arise with high quality posting, but to me it indicates that some extra scrutiny might be in order.
If our goal is to reward content that brings clicks and eyeballs, one thing we can do is to allocate more voting power to authors with more followers.
Median follower reputation
All followers are not created equal. If the curator decides to increase the voting percentages based upon follower counts, it would be a simple enough matter for people to create large numbers of fake follower accounts. However, these accounts would generally have low values in their wallets and - by default - their reputation scores would also be low. It's harder to artificially boost those values at large scale.
As discussed in Programming Diary #10, there are at least two ways to get an estimate of an author's follower quality. One method is the median SP in the followers' wallets, and a second method is the median follower reputation. Getting the median SP from the follower's wallets is more challenging to program, so I elected to stick with the follower reputation for now. Here's a simple shell script that calculates the value:
#!/bin/bash

getMedian()
{
   list=$1
   size=$(echo ${list} | wc -w)
   midPoint=$( echo ${size} | awk '{printf "%d", $1 / 2}' )
   if [ $(( ${size} % 2 )) -eq 1 ]
   then
      median=$(echo ${list} | awk '{print $('${midPoint}' + 1)}')
   else
      median=$(echo ${list} | awk '{print ($('${midPoint}') + $('${midPoint}' + 1))/2}')
   fi
   echo ${median}
}

start="null"
LIMIT=1000
IDX=0
ACCOUNT=${1}
API=https://api.moecki.online

followCount=$(curl -s --data '{"jsonrpc":"2.0", "method":"follow_api.get_follow_count", "params":{"account":"'${ACCOUNT}'"}, "id":1}' ${API} | jq -S .result.follower_count)

repList=$(
   while [ ${IDX} -lt ${followCount} ]
   do
      tmpStr=$(curl -s --fail --data '{"jsonrpc":"2.0", "method":"follow_api.get_followers", "params":{"account":"'${ACCOUNT}'","start":'${start}',"type":"blog","limit":'${LIMIT}'}, "id":1}' ${API})
      start=$(echo ${tmpStr} | jq -S .result[].follower | tail -1)
      tmpStr=$(echo ${tmpStr} | jq -S .result[].reputation)
      IDX=$(( ${IDX} + ${LIMIT} ))
      tmpLength=$(echo ${tmpStr} | wc -w)
      if [ ${IDX} -lt ${followCount} ]
      then
         tmpLength=$(( ${tmpLength} - 1 ))
      fi
      for W in ${tmpStr}
      do
         echo ${W}
      done | head -$(( ${tmpLength} ))
   done | sort -n
)
median=$(getMedian "${repList}")
echo Followers: ${followCount}
echo Median: ${median}
And here is some sample output:
$ ./get_followers.sh remlaps
Followers: 1959
Median: 47.31
$ ./get_followers.sh remlaps-lite
Followers: 703
Median: 46.99
$ ./get_followers.sh steemitblog
Followers: 39476
Median: 40.57
$ ./get_followers.sh o1eh
Followers: 466
Median: 62.27
$ ./get_followers.sh moecki
Followers: 237
Median: 61.96
$ ./get_followers.sh steemchiller
Followers: 6072
Median: 52.375
$ ./get_followers.sh cmp2020
Followers: 3150
Median: 48.105
One thing that initially surprised me, but made sense after reflection is that people with higher follower counts often have somewhat lower scores in the median follower reputation, so it's not as simple as "higher is better", but you can start to get a sense of things by looking at the two numbers together.
Why should voters consider these values?
I see two reasons why voters might want to incorporate factors like these in their voting strategy. First, if vote size is directly linked to follower counts (audience size), this creates an incentive for authors to pay more attention to audience building. In watching the follower counts of the VAAS posts, I have been really surprised at the number of authors with high reputations and follower counts in low double-digit ranges.
Second, and perhaps more importantly, it will help to identify and strengthen the interconnected clusters of people who are using the blockchain in a cooperative fashion. If you have a high follower count and your followers have a high median reputation, this might indicate that you're participating in a more fruitful section of the ecosystem. As I noted in last week's Programming Diary, a high level of density may be necessary in collaborative groups if the cooperators are going to have a chance at overcoming the defectors in our little version of the iterated prisoner's dilemma.
Of course, there are other factors and this is just an approximation, but I think that partial information here is better than no information at all.
Looking ahead
Finally, as with previous weeks, I'll pull forward the longer term goals which won't come into play until I'm satisfied with the state of this toy Steemometer project.
- A standalone desktop UI that gives the user independence from web sites and focuses on increasing social media velocity;
- A protocol and framework that I'm bouncing around in my head for decentralized abuse measurement and resistance; (note to self, I'd better write this down before I forget what I have in mind...)
- A new version of @penny4thoughts that will be more tolerant to Steem API interruptions, extend a post's engagement lifecycle beyond 7 days, and let the author be more flexible in rewarding commenters.
- After I get done with the Steemometer, I think my next project will be a fairly simple 2 person game that will utilize Steem's content for the subject matter and use custom_json transactions for communications between the players.
Not necessarily in the order above.
Additionally, related to #2 - I have now had an idea for bringing Quorum Sensing to bear on the abuse problem. It's slightly different from the other approach I have in mind, and the two approaches might or might not be complementary. I haven't thought through it enough yet.
Also, I've been thinking about the possibility of a private messaging/chat application that encrypts its messages using memo keys and sends them using
custom_jsontransactions.
That's it for today. Hope to see you again in two weeks.
Happy New Year!
Thank you for your time and attention.
As a general rule, I up-vote comments that demonstrate "proof of reading".

Steve Palmer is an IT professional with three decades of professional experience in data communications and information systems. He holds a bachelor's degree in mathematics, a master's degree in computer science, and a master's degree in information systems and technology management. He has been awarded 3 US patents.


Pixabay license, source
Reminder
Visit the /promoted page and #burnsteem25 to support the inflation-fighters who are helping to enable decentralized regulation of Steem token supply growth.
Thanks for your update.
I don't have much time now, but I wanted to briefly comment to your Python problem:
Sometimes Steemchiller adds or changes fields with the result that the number of "columns" and order changes.
For this he adds the entry
cols. The safest way to access the data is therefore e.g.:rows[0][cols["author"]].Then the order doesn't really matter and only a change in the field name can cause complications. However, he announces this early on.
Perfect. Thanks. I noticed that the first entry had the column indexes while I was trying to track down the problem, but I didn't take the time to make use of it. Now, I went ahead and updated it.
Upvoted. Thank You for sending some of your rewards to @null. It will make Steem stronger.
Your post has been successfully curated by @𝐢𝐫𝐚𝐰𝐚𝐧𝐝𝐞𝐝𝐲 at 35%.
Thanks for setting your post to 25% for @null.
We invite you to continue publishing quality content. In this way you could have the option of being selected in the weekly Top of our curation team.