Are Volcanoes Awakening in a Cosmic Cycle?
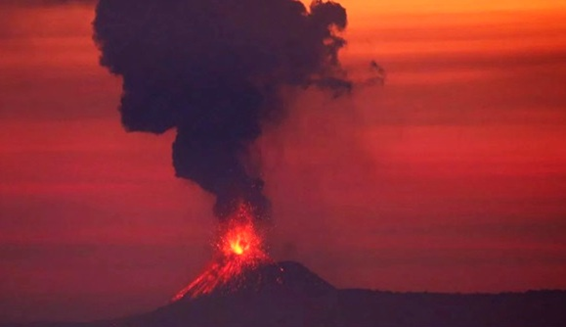
If you hadn’t seen over the weekend, Krakatoa, the very famous volcano that erupted in the late 1800’s sending a tsunami that circled our planet four times and was heard thousands of miles away in a ferocious explosion. Luckily it didn’t have the “year without a summer” power that Tambora did in the early 1800’s.
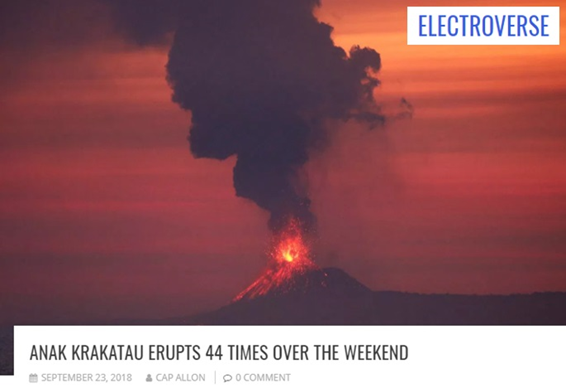
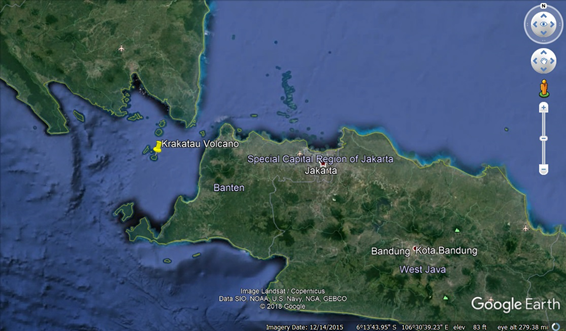
Nevertheless this is a volcano that if it does go off it will have incredible ramifications for Singapore and Jakarta and the world economy will grind to a partial stop as Asia halts all air traffic through and into Singapore and Jakarta, these are major transport hubs on our planet.
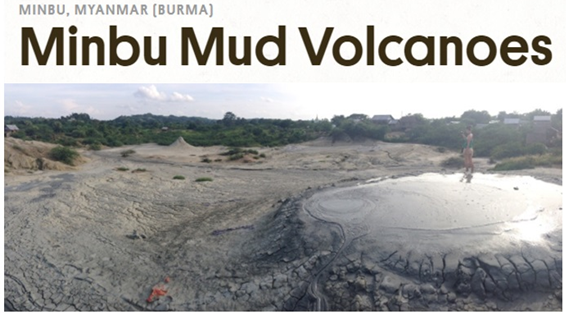
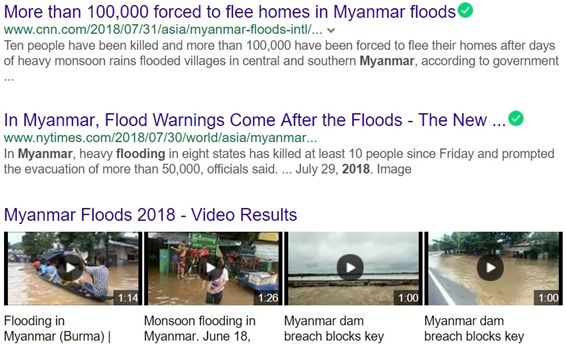
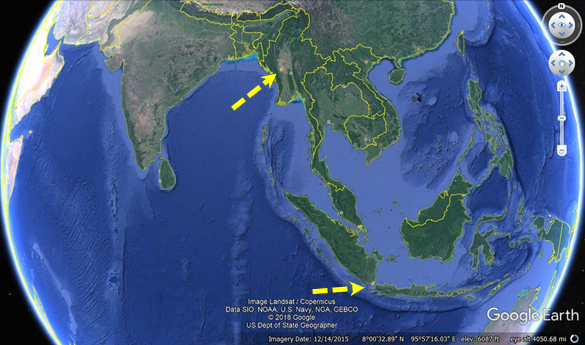
At the same time, the Minbu Mud volcanoes are starting to become incredibly active in Myanmar.
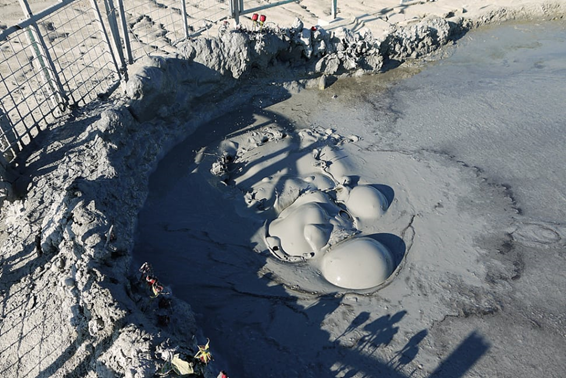
When this thing starts to bubble, the monks actually go and pour milk into where the bubbles came up from the mouth of the Dragon. It’s a sacred spot and I could see why, because when this area starts upticking in activity, locals understood that the weather changed, rainfall patterns change around Myanmar.
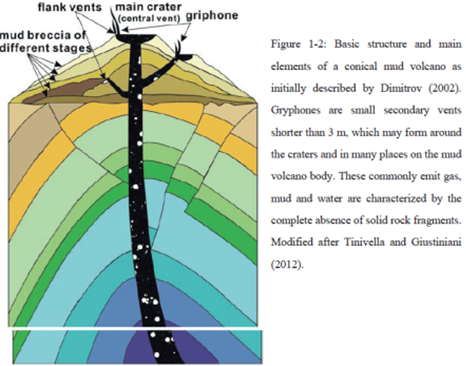
(BELOW) Interesting graphic here of the structure of mud volcanoes and differences between regular eruptive volcanoes. If this thing increased in mud and gas emissions, and there were eruptions down in Krakatoa, you just have to wonder what’s going on under the plate there.
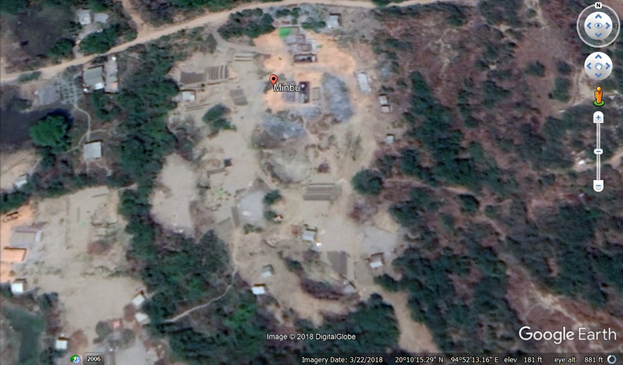
Google Earth taking a look at Minbu, you can see the volcano, the center circular hole. As you circle around the area anywhere you see gray areas these are mud pits that have opened up.
Generally it’s placid as you see in the image here, but I was alerted to the increase in activity from a couple of friends I have in Myanmar because I used to buy coffee there and they know I follow weather changes.
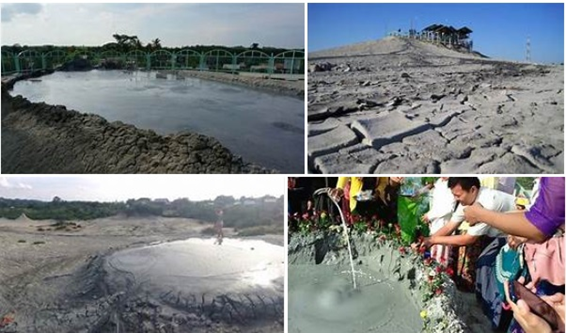
We were talking about the weather changes and massive floods that have occurred this year, places that it hadn’t flooded in hundreds of years that anybody alive today could remember where the old high water marks were. but the Minbu area specifically and then the surrounding area of Kyaukpyu, reports are that everything has become active in the hot springs and also the mud volcanoes around that area extending all the way over to the coast.
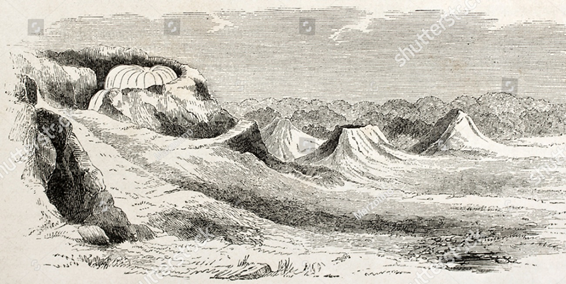
This area has on and off eruptivity and can taper off for years on end. These Lithograph were done in the 1800’s showing the increase in the size of the cones.
If you haven’t been in Myanmar there are some amazing places to travel there as well, Bagan and Ramree Island that’s up near Kyaukpyu, where the beaches are really that unspoiled as you see in this image and the temples at Bagan are as good as anything that you’ll find Angkor Wat in Cambodia with less tourists.

Speaking of these ancient cultures and ancient cycles that pervade our planet, this is an overlay of sunspot numbers with Centennial Cycles, De Vries Cycles, Bray Cycles, Brahe Cycles and Grand Solar Minimum Cycles. You can see there are more heavy powerful cycles interweaving with smaller cycles.
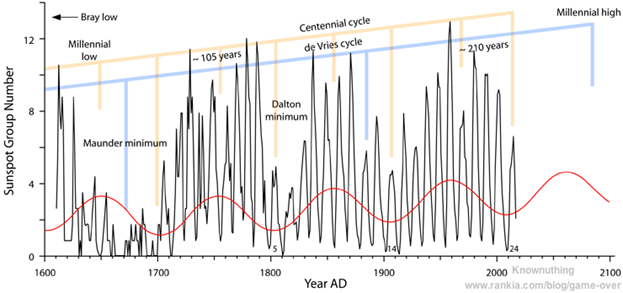
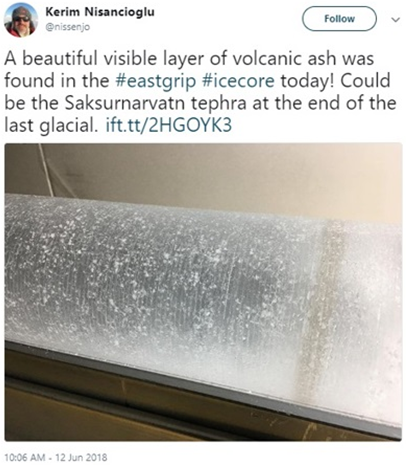
This is what we are up against here because it’s very noticeable when we have larger eruptive activity and now how regular and cyclical these deposits are in ice cores. That’s one thing to ponder in itself.
But when we take a look at these areas thousands of miles away both starting to uptick.
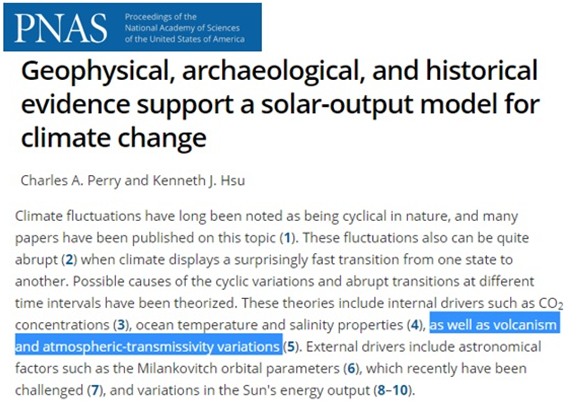
From the National Academy of Sciences “Historical Evidence for Solar Output Models and Climate Change” they even reference volcanism cycles and atmospheric variations.
There are some absolutely stunning graphics in this for you to take a look at.
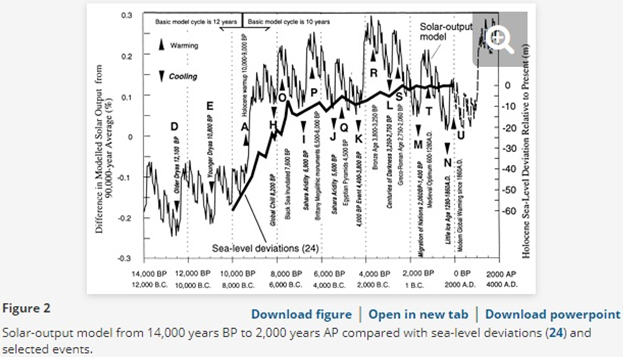
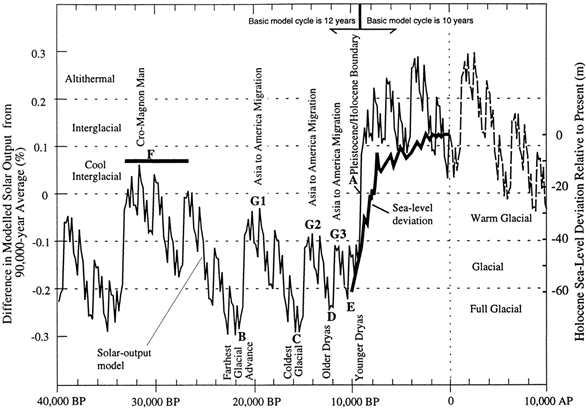
This takes us from the Younger Dryas up to the modern era and what it shows is the ebbs and flows of civilization based on solar output. You can see where the dark ages or squeeze points or reduction in human civilization occurred in the cold times, and you can see the abundance that we have thrived in during these warm times.
Temperatures are not constant on this planet, they’re continually moving, you can see this through historical records.
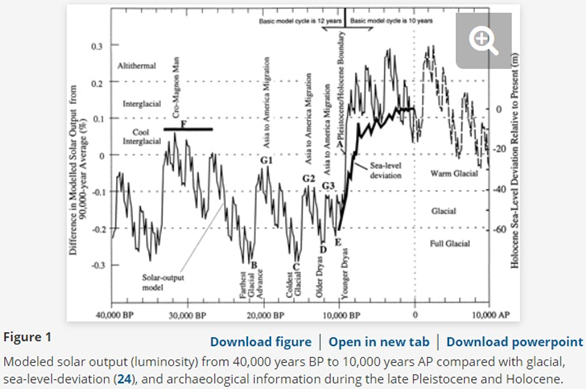
I just can’t believe the CO2 myth still continues with such ferocity when we have such good scientific data to show otherwise. That CO2 has minimal impact into the climate cycle, that there’s so many other variants here that are pushing and changing our weather on Earth and Grand Solar Minimums would be one of them.
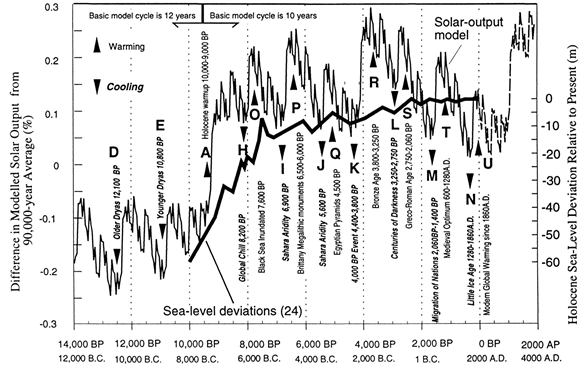
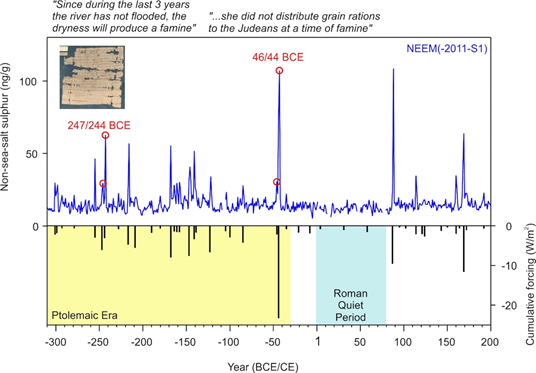
This is one of the most important charts I think because it’s a shorter time duration back to 400 BC.
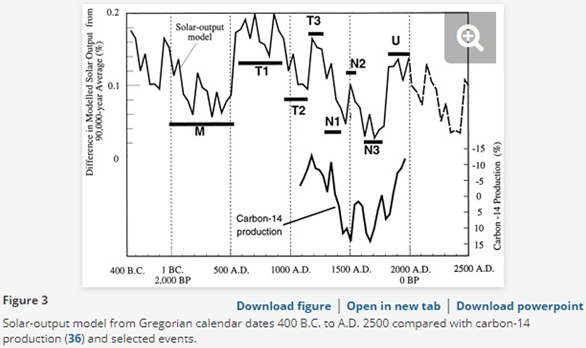
That can be overlapped with scientific data in eruptive events that were cataloged through history, so where you see a downturn it means solar activity decreased. Now all we have to have to do is try to line this up. So keep in mind that left side of the chart there is 400 BC., and you see how it declines.
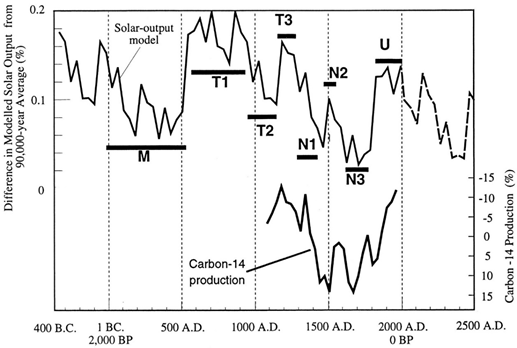
Let me take a look at the next chart here, where they’re overlapping volcanic activity and different eras across the planet. Notice 46 BC. that ends up with the exact lowest point in solar activity, so you wonder if it’s a correlation here.
Take a look also into some other eruptions that were known and unknown from Vanuatu to Indonesia over the last 2000 years.
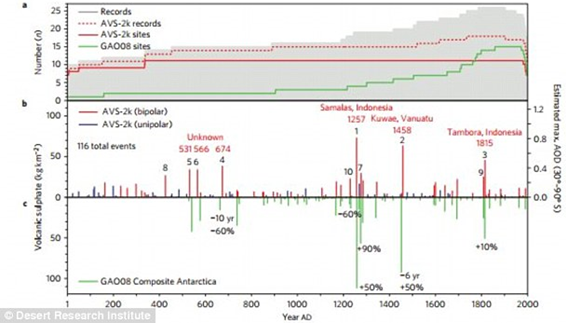
All we’re trying to do is match time, so I had to squeeze the bottom chart to show a match up with the 500 the 1500 AD mark. I put the links for everything below, so you can go ahead and cross-reference and do some of your own research.

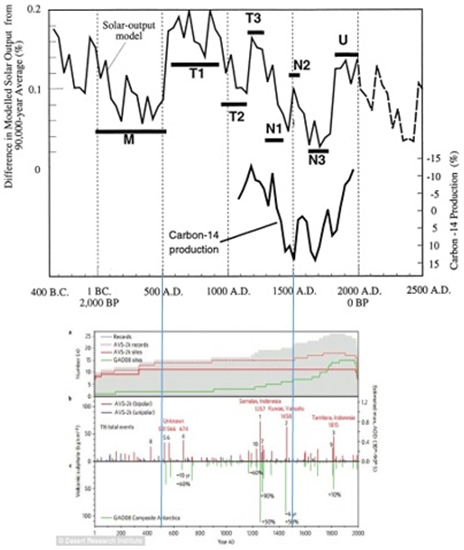
When we take a look at some of these other cycles for known Grand Solar Minimums, look at that 1275 AD era with all the volcanic emissions and around the 1800’s & 1500’s we’ll go back to 500–600 AD.
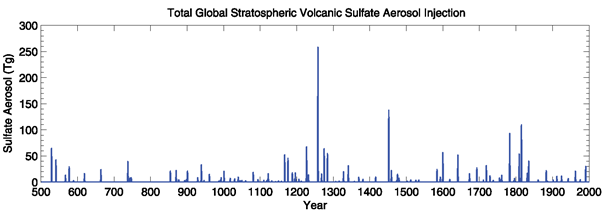
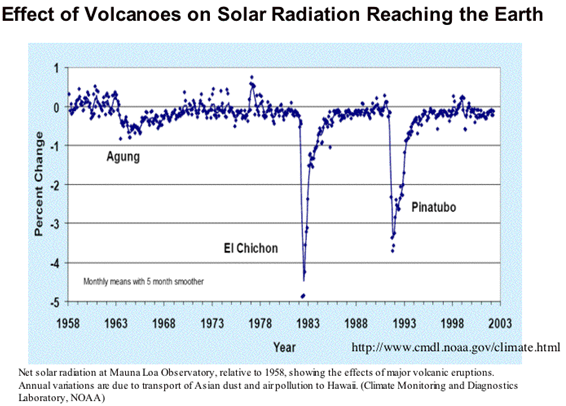
Bringing you up to the modern era, you can also see how much effect solar radiation reduction there was from volcanic activity: Pinatubo, El Chichon and Agung.
Thanks for reading, hope you got something out of the article. I left everything so you can do your own research because yours without a summer our civilization destroyers.
If you like this type of analysis, take it on the go with Mini Ice Age Conversations Podcast, thirty minutes piecing together how the intensifying Eddy Grand Solar Minimum will affect your life over the next 5 years.
ADAPT 2030 My Patriot Supply Links: Take the fear out of difficult situations
2-Week Food Supply: (1,500+ calories/day with 92 servings) www.preparewithadapt2030.com
Hearty Soups Kit with 104 servings http://bit.ly/2A4c1hk
*** ADAPT 2030 True Leaf Market Link ***
http://www.pjtra.com/t/SkNITkxPS0xDR0xPRkdLQ0dLSUdOSw
*** Today’s Story Links ***
Ten most impressive food heists https://www.theguardian.com/lifeandst...
Geophysical, archaeological, and historical evidence support a solar-output model for climate change http://www.pnas.org/content/97/23/124...
Minbu Mud Volcano increases activity Myanmar
https://www.atlasobscura.com/places/m...
http://escapingthedesk.com/the-mud-vo...
https://nyiwin.wordpress.com/2016/10/...
ANAK KRAKATAU ERUPTS 44 TIMES OVER THE WEEKEND
https://electroverse.net/anak-krakata...
MIAC #105 Substantial Crop Losses Globally & The Economics of Rising Food Prices
http://adapt2030.libsyn.com/miac-105-...

*** ADAPT 2030 Social Media Links ***
1.) PATREON www.patreon.com/adapt2030
2.) BITCHUTE https://www.bitchute.com/hashtag/adapt2030/
3.) STEEM https://steemit.com/@adapt2030
4.) *** ADAPT 2030 True Leaf Market Link ***

5.) Mini Ice Age Conversations Podcast
Libsyn: http://adapt2030.libsyn.com/
iTunes: https://itunes.apple.com/us/podcast/adapt-2030-mini-ice-age-conversations/id1200142326
6.) FB https://www.facebook.com/Miniiceage
7.) TWITTER https://twitter.com/adapt2030
8.) YOUTUBE www.youtube.com/user/MyanmarLiving

9.) MEDIUM https://medium.com/@globalcooling
Hey! Glad to see you here, sorry I did not notice sooner!