Topdown Analysis Of DYDXUSDT Using Support And Resistance Strategy And RSI Indicator As A Confluence
Hello great minds,
I feel excited to come before you all this evening to relate with you on another interesting post in the community.
I trust you are all doing perfectly fine and are enjoying your activities in the community as you actively promote steemit across various social media platform.
Today I will be sharing my analysis on dydxusdt just as I used to in the community, please stay tuned.
ANALYSIS USING SUPPORT AND RESISTANCE STRATEGY
Dydx is a good token in the cryptospace which is one reason I have chosen it for my analysis today.
And I will be sharing the latest price movement as at when this post was made.
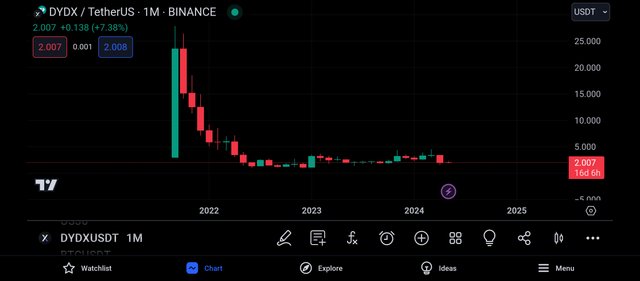
I decided to begin my analysis on the monthly timeframe just as seen above.
And on this timeframe, we can see that there are less candles on the price chart, which indicates the presence of buyers and sellers in the market.
And also, the monthly timeframe helps to filter out noise from the market as each candle is formed within the time period of 1month.
Also on this timeframe, it is very easy for the market overall trend to be detected, and from the screenshot above, we can see that the market is being bearish overall.
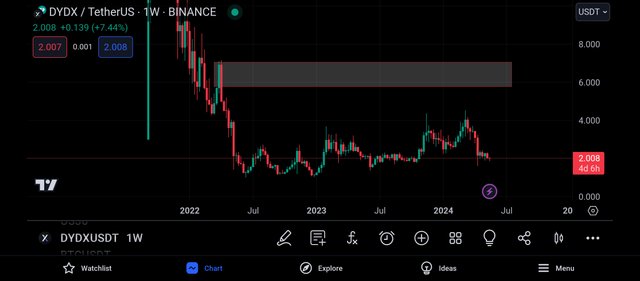
I then continued my analysis by moving to the weekly timeframe, and on this timeframe, I can see more candlestick than on the monthly timeframe.
And on this timeframe also, I was able to identify a key market level and this level is functioning as a resistance level to the market price.
And it is expected for the market to be rejected whenever it gets to this level, and this level is a valid level because it has been respected severally by the market price.
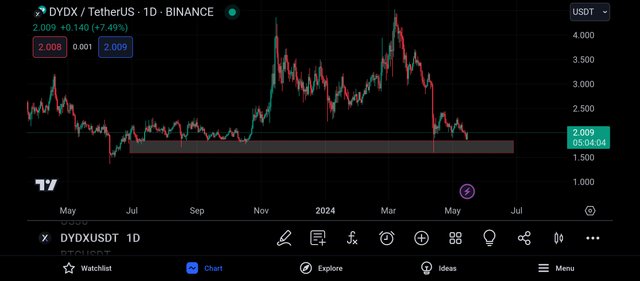
Continuing my analysis on the daily timeframe, I noticed that there are more buying and selling on this timeframe than on the weekly timeframe.
I could see the buyers and sellers trying to show their presence in the market by attempting to push price to their preferred direction.
Also on this daily timeframe, I was able to spot a support level, and this level is a valid level because it has been severally respected by market price.
And I expect to see a bullish rejection whenever the market trades to this level.
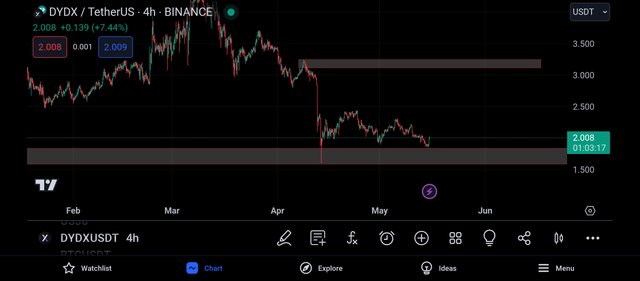
Getting to the 4hr timeframe, I could see noise in the market.
I could clearly see the struggle between bulls and bears as they try to take control of the market.
Also on this timeframe, I was able to identify a key level and this level is functioning as a resistance level to the market price.
And since I have a bullish bias of the market, this level will be my take profit region because the market will experience some difficulty before it's been able to break above this level.
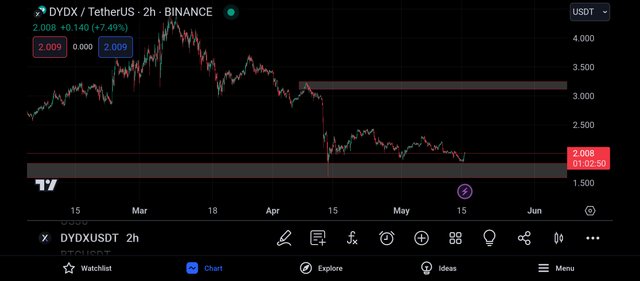
I then continued by moving to the 2hr timeframe as it is on this timeframe that I search for my entry into the market.
On this timeframe, I noticed that the market has traded to a strong support level and as anticipated, I could see rejection candles.
It is on the formation of these rejection candles that I intend to take my entry into the market.
And before that, I decided to search for confluence using the rsi indicator.
CONFLUENCE USING RELATIVE STRENGTH INDEX INDICATOR
The rsi Indicator is a very important trading tool in the cryptomarket.
The rsi indicator is used to spot oversold and overbought market regions.
And when a market is spotted to be oversold, it is a signal that the market is about to experience a bullish move.
And when a market is spotted to be overbought, it is a signal that the market is about to experience a bearish move.
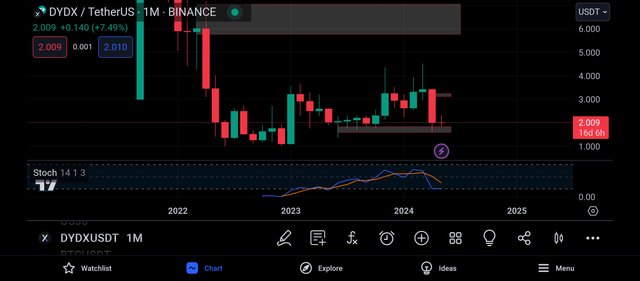
Applying the rsi to the monthly timeframe, I noticed that the rsi has crossed below its 20% line and this is an indication that the market is being oversold.
An oversold market often signals a bulllish trend reversal, that is we expect to see the buyers take control of the market.
And this is in alliance with our analysis using support and resistance strategy.
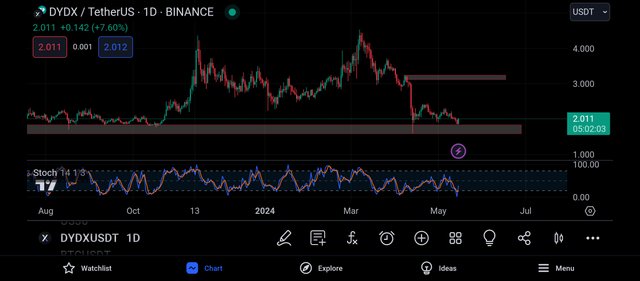
On the daily timeframe, I noticed that the market is being oversold as it's rsi has crossed below its 20% line.
And an oversold market region signifies a bullish trend reversal, that is, an indication that the buyers will soon take over the activities of the market, and this is in alliance with my analysis using support and resistance strategy.
Then I continued to the 2hr timeframe in search of entry into the market.
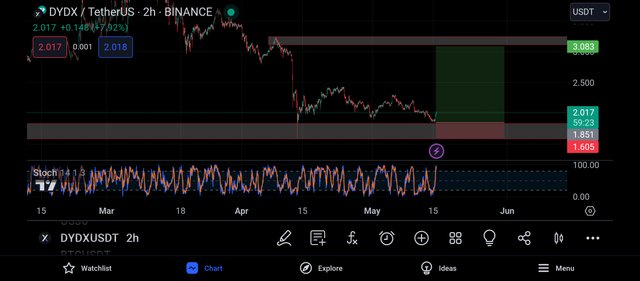
Moving to the 2hr timeframe, I noticed that the rsi has crossed above its 80% level but my bias have been built already.
Then I went ahead to place a buy order on the closest support level to the market price and my take profit was placed on the closest resistance level to the market.
CONCLUSION
Dydx is actually a very good token but before investing in it, I'll advise that you make your personal research about it.
My post was made for educational purpose and not as a financial advice.
https://twitter.com/JuecoYoung/status/1790845279941386595
Upvoted! Thank you for supporting witness @jswit.