Analysis of the internal STEEM/SBD market place
Link to the github repository
https://github.com/steemit/steem
1. INTRODUCTION
Continuing the sequence that I started in my previous contribution where I analyzed the flows of rewarded tokens, this time I focus on the so-called MARKET or internal market where it is possible to exchange STEEM and SBD with other users.
I want to analyze the evolution of the market and the current state of its use in number of orders, volumes of exchanged tokens, statistical characteristics of the exchanges, the most active accounts, etc. This topic is especially interesting to me since it is related to the trading activity.
2. SOME PREVIOUS BASIC CONCEPTS OF A MARKET
For users who do not know how a market works.
2.1 TOKENS EXCHANGE AND LIMIT ORDERS
LIMIT ORDER
A limit order is an order to buy a security at no more than a specific price, or to sell a security at no less than a specific price (called "or better" for either direction). This gives the trader (customer) control over the price at which the trade is executed; however, the order may never be executed ("filled").
STEP 1
The basic idea starts with the desire for an account @A to convert a certain amount of SBD to STEEM (buy STEEM) and a account @B that wants to convert a certain amount of STEEM to SBD (sell STEEM).
Then, the conversion of tokens is carried out by exchanging tokens between at least two accounts. The price of the operation is given by the relative values between both types of tokens (SBD) / (STEEM) and it is necessary to agree with another account that wants to make an exchange with that same price in the reverse direction and for the same amounts of tokens.
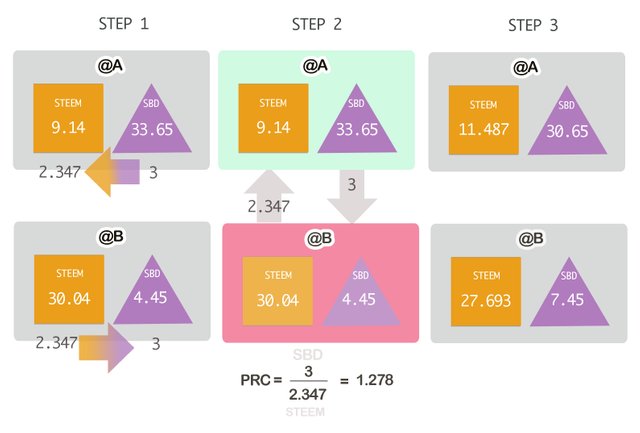
STEP 2
The @A account create what is called a LIMIT ORDER since it limits the "worst price" (maximum in case of buying and minimum in the case of selling) that is willing to admit (defining the amounts of tokens that you are willing to give and receive). The @B account will close the transaction if it issues another limit order with the same price and the same amounts.
STEP 3
Through the market, @A transfers SBD to @B, and @B transfers STEEM to @A and the two limit orders are considered filled.
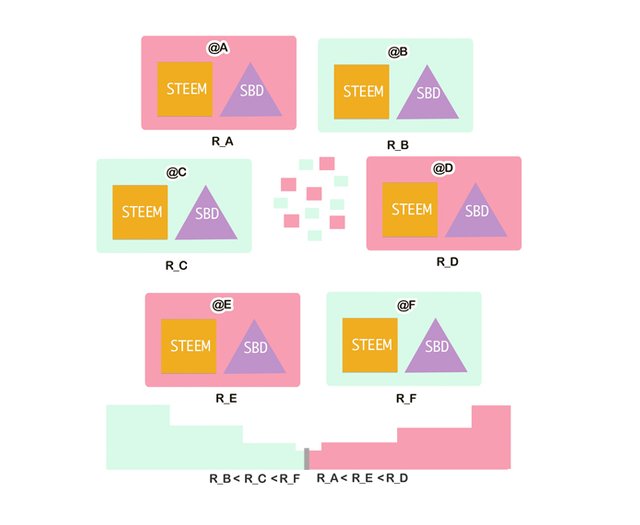
2.3 ORDER BOOK
An order book is the list of orders that a trading venue uses to record the interest of buyers and sellers in a particular financial instrument. A matching engine uses the book to determine which orders can be fulfilled i.e. what trades can be made.
To avoid the need for two accounts to exchange exactly the same amounts, the market becomes efficient by gathering many limit orders and allowing a buying order be filled with several selling orders (or vice versa), delaying the closing of the transaction until the conditions allow it to be carried out.
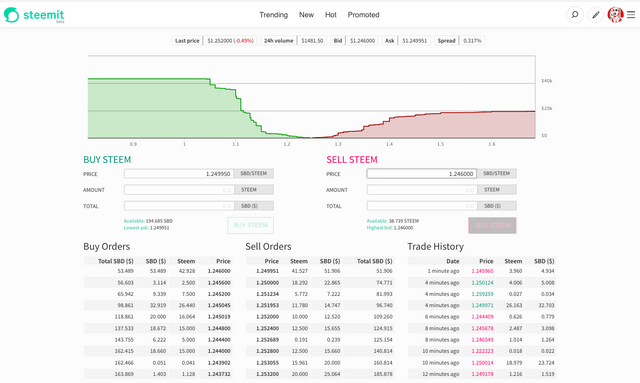
The depth chart that can be seen in the MARKET section of Steemit is a representation of the ORDER BOOK that shows the limit orders (or the intentions) of buyers (green) and sellers (red) ordered by the price (proportions SBD / STEEM) from minor (left) to major (right).
The height of the green and red columns show the volumes or quantities of tokens willing to exchange at a certain ratio or price. Both groups of columns in the form of waterfalls of contrary directions are united through a gap delimited by the higher buying price and the lower selling price and is called the SPREAD that varies in size, for example of 0.048% (I have investigated that has reached a maximum value around 2.5%)
The limit orders can be canceled at any time so the order book and its graph are modified.
Given an equilibrium situation if a new buying order is created (for a price higher than the minimum selling price) the market produces the matching between two or several limit orders producing the order book, its graph and the price to move up.
An equivalent process, but in the opposite direction, occurs when a selling limit order with a lower price than the highest buying price is created.
The way in which these movements are produced, that respond to the confluence of offers and demands, have a behavior that can be analyzed using graphs that include the movements of the price over time that are the typical graphs that a trader handles through technical analysis to perform numerous buying and selling orders from which it is possible to obtain benefits (and losses).
2.4 OPEN/ CLOSE ORDERS - BUYING/SELLING ORDERS
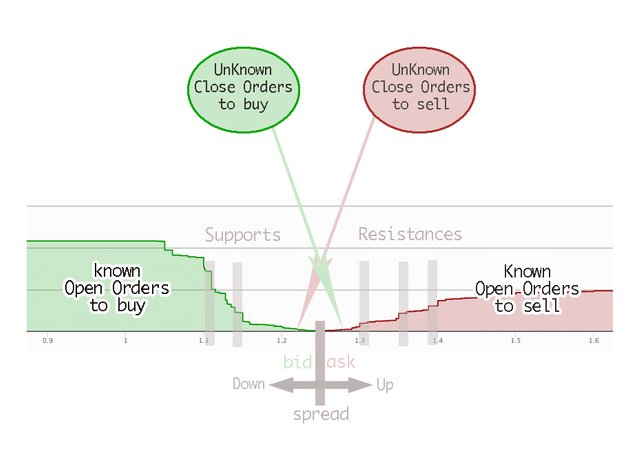
OPEN ORDER
It is an order, (buy or sell) that due to its ratio or price demanded can not be matched with other orders at the time it is created and remains active and waiting until it is canceled, expires or filled. The account or user that creates this order is called open owner.
CURRENT OR CLOSE ORDER
It is a limit order (buy or sell) that can be paired with other existing orders in the order book at the time of its creation. The account or user that creates this order is called close or current owner.
2.5 FIlLED ORDERS
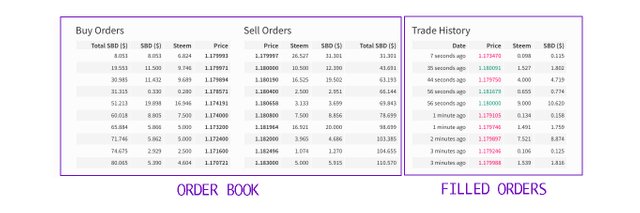
When a close order is matched with one or several open orders, the exchange of tokens is executed and an filled order is created with the information of the number of tokens exchanged and the accounts involved in the operation and this set forms the Trade History.
3. ANALYSIS
I will follow this scheme
3.1. ORDER BOOK ANALYSIS
3.2 TRADE HISTORY ANALYSIS
- 3.2.1 NUMBER, OWNERS AND SOME PROPORTIONS OF THE FILLED ORDERS
- 3.2.2 TOTAL VOLUMES OF EXCHANGE TOKENS
- 3.2.3 TYPICAL VALUES OF A FILLED ORDER
- 3.2.4 DO YOU WANT TO TRADE? ( Or a look at the daily price)
- 3.2.5 THE MOST ACTIVE PLAYERS IN THE MARKET
3.1. ORDER BOOK ANALYSIS
The information about the order book of the market can be found in the table TxLimitOrders
RAW DATA
SQL QUERY
SELECT   orderid, owner, cancel, fill_or_kill, timestamp
FROM TxLimitOrders

PROCESSED DATA
- COUNT(orderid)
- UNIQUE COUNT (owner)
- COUNT (cancel = TRUE)
- COUNT (fill_or_kill = TRUE)
- GROUP BY (timestamp in MONTHS)
Below I represent the most relevant data in the following graphs that show the time evolution by months of some aspects of the Order Book.
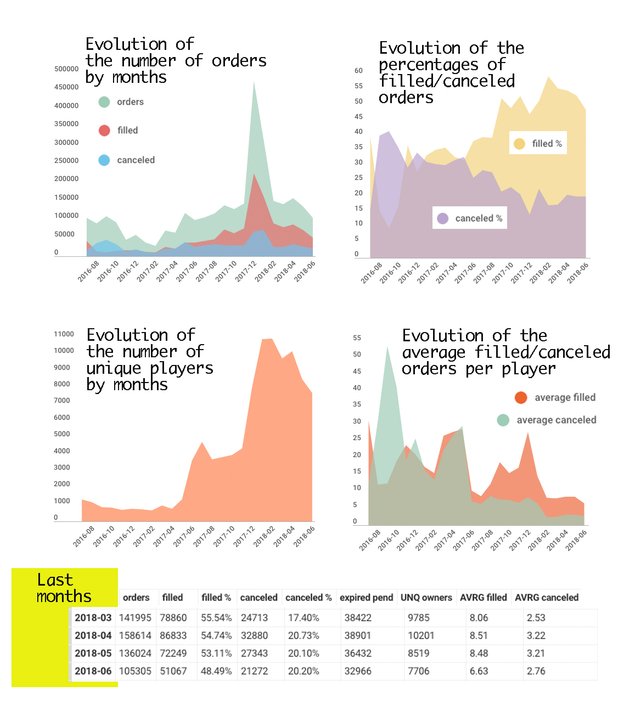
After the peak of January 2018 the volume of monthly orders has fallen in the last three months and is at a level of 120k with a percentage of canceled orders that seems to stabilize around 20% and the percentage of filled orders fluctuates around 50%
The monthly users or players also have descended from more than 10k in January 2018 to stand at 8k.
Regarding the evolution of the average number of orders filled and canceled orders, it has been reduced and becoming more stable.
3.2 TRADE HISTORY ANALYSIS
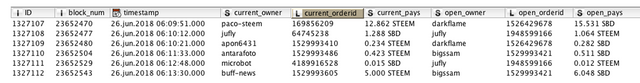
The information about the orders that have been executed and therefore about the exchanges of tokens between users is found in the VOFillOrders table.
RAW DATA
SQL QUERY
SELECT ID, timestamp, current_owner, current_orderid, current_pays, open_owner, open_orderid, open_pays
FROM VOFillOrders
3.2.1 NUMBER, OWNERS AND SOME PROPORTIONS OF THE FILLED ORDERS
PROCESSED DATA
- COUNT(ID)
- GROUP BY (timestamp in MONTHS- 7 digits)
Number of orders
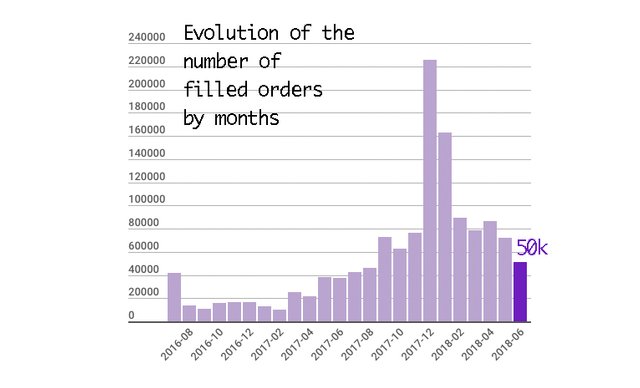
The current volume of filled orders is in values similar to those of a year ago, around 50k after a gradual decline since the peak of December 2017
Types of Orders, Owners and their proportions
I have count the unique orderid and ownerid values that identify the filled orders (open or close-current) that are part of each record of the VOFilledOrders table grouped monthly to know the proportions of each type of orders and owners.
PROCESSED DATA
- UNIQUE COUNT OF (current_owner, current_orderid, open_owner, open_orderid,)
- GROUP BY (timestamp in MONTHS- 7 digits)
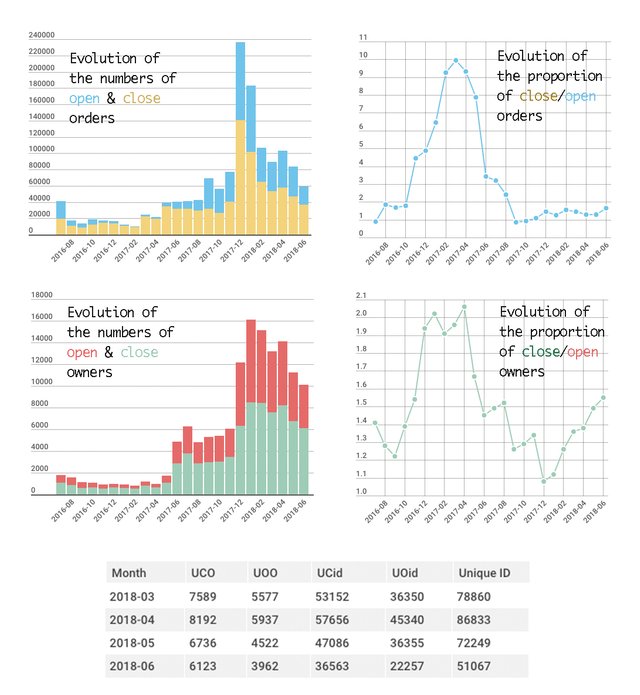
UCO: Unique Close Owner; UOO: Unique Open Owner;
UCid: Unique Close id, UOid: Unique Open id
About Orders types
The proportion of close orders has been normally greater than the open orders which means that several close orders are required to macth an open one due to the greater amount of tokens of the open orders. However in the last months the proportion is only around x1.5 contrasting with the proportion of x10 that there was in 2017-03.
About Owners types
Relative to the owners that are involved in the filled orders something similar happens, currently needing 1.55 close-current owner for each open owner.
3.2.2 TOTAL VOLUMES OF EXCHANGED TOKENS
In this section I analyze the volumes of tokens exchanged between the paired orders, calculating and showing their monthly evolution.
PROCESSED DATA
- SPLIT current_pays and open_pays into amount and currency (STEEM/SBD)
- SUM Amounts of STEEM
- SUM Amounts of SBD
- GROUP BY (timestamp in MONTHS- 7 digits)
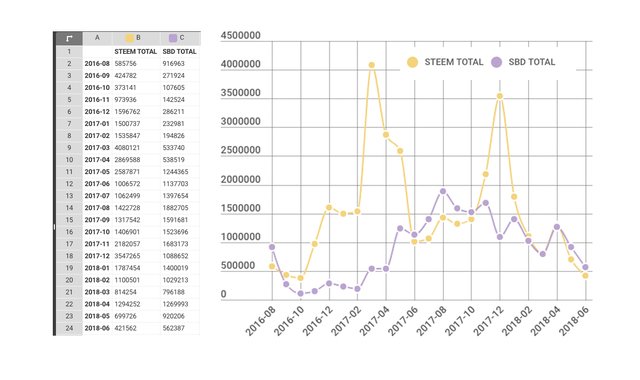
- Regarding the volumes of exchanged tokens, we observe that they are currently in low and similar values for both types of tokens because their rate of change fluctuates around 1.25 as we will see below.
Total volumes of Tokens, differentiating between selling and buying orders
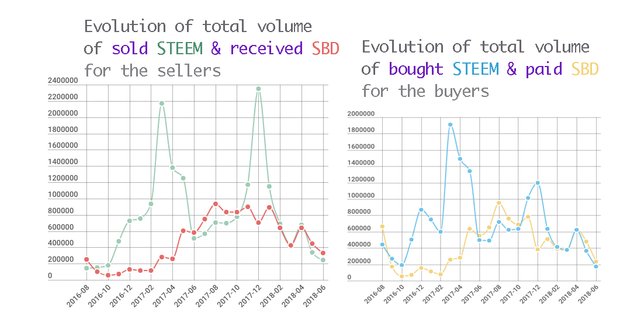
- Both graphs have similar forms although the volumes of sold STEEM tend to be larger than those bought. Keep in mind that some users use the strategy of selling STEEM in the internal market and buy it in other markets at a better price and obtain higher profits, although the volume are currently in similar values around 200K which indicates that this kind of practice is currently not used as much.
Evolution of the average price
Calculating the ratio of the amounts of SBD/STEEM (which we can simply call the price of STEEM valued in SBD) we obtain this strange figure.
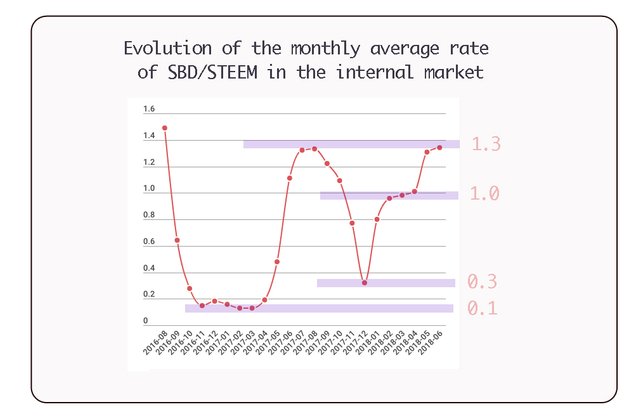
- We see that the value varies between a minimum of 0.1 and a maximum of 1.5
- The value of 1 is important since it is reached when the value of 1 STEEM matches that of 1 SBD.
- Currently it is close to 1.3 which indicates that 1 STEEM = 1.3 SBD.
- Remember that it is the average monthly value and that the daily evolution (or in hour or minute intervals) will show much broader and "noisy" variations as I will show below.
3.2.3 TYPICAL VALUES OF A FILLED ORDER
TOKENS AMOUNTS
Previously I analyzed the total volume of tokens exchanged in the internal market, now I focus on the statistical values of the amounts of tokens exchanged in each filled orders namely, the mean and standard deviation of these amounts differentiating between selling orders and buying orders.
PROCESSED DATA
- SPLIT Amount of STEEM pays into SELL and BUY Orders
- MEAN of the Amounts of STEEM (Sell/Buy) orders
- STANDAR DEVIATION of the Amounts of STEEM (Sell/Buy) orders
- GROUP BY (timestamp in MONTHS- 7 digits)
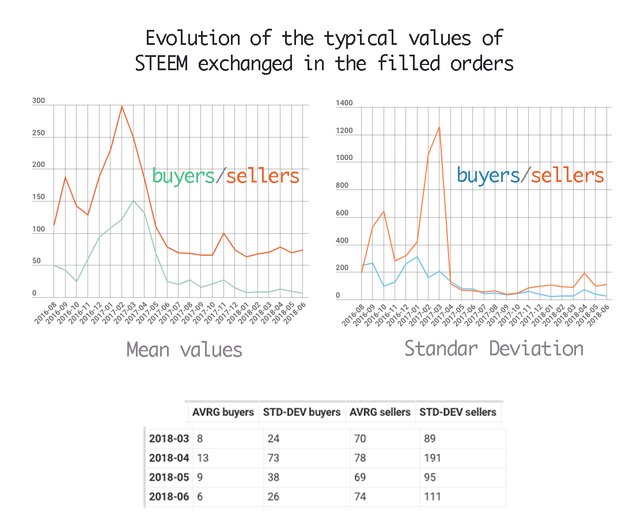
The first thing we see is that the means and stardard deviations have stabilized in the last months for both selling orders and buying orders, since until 2017-04 they had fluctuated in very large values.
Both the mean (x12) and the standard deviation (x4) of the selling orders are greater than those related to buying orders.
This shows that statistically when STEEM is bought it is done with orders for smaller quantities (it is bought little by little) and when STEEM is sold it is done with orders with larger quantities (it is sold fast). This is common in all markets, so buying orders are called long-positions and selling orders are called short-positions.
TIME DELAY
How long does it take, statistically speaking, for an open order to be filled?
Using the two tables I have taken the timestamp of the filled-orders and searched in the table of the limit-orders the timestamp of when they were created and subtracting these values to calculate the delay, (measured in hours), of each open order in being filled.
Later I have calculated the Mean and the Standar deviation of the obtained values. The results are summarized in the following graph:
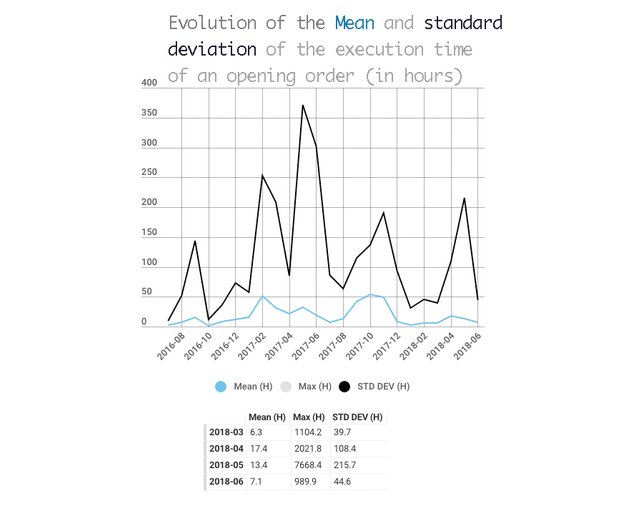
- So currently, an open-order needs an average of 7 hours to be filled with one (or several) close-order and the exchange occurs. (With a standard deviation of about 44 hours).
- The Mean reached 50 hours in October 2017 and the standard deviation over 350 hours in May 2017.
3.2.4 DO YOU WANT TO TRADE? ( Or a look at the daily price)
By conveniently executing buy and sell orders, profits (and losses) can be generated (both in STEEM and in SBD). For traders, it does not matter that the price goes up or down, but that it moves.
The idea is simple, buy STEEM when it's cheap and sell when it's expensive. Doing it again and again accumulating small percentage gains such as 0.5% or 1%.
But to do this it is necessary to know what is happening with the daily price for time periods of hours or even minutes. Here I represent the price calculated from all existing orders for five consecutive days: 22,23,24,25 and June 26, 2018 to analyze its behavior.
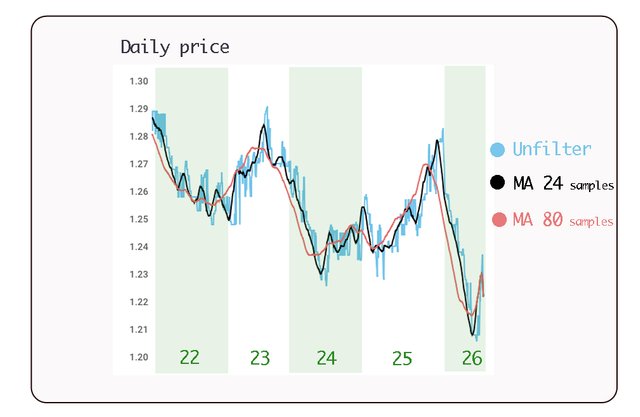
In blue, the unfiltered samples are represented and, as can be seen, there are many noisy fluctuations. In black and red it shows typical Moving Average (MA) to eliminate noise and visualize the tendency more clear.
As you can see, there is a generic behavior in which the price rises progressively during two days, making several undulations until reaching a resistance where it begins to fall more quickly (although there may also be undulations) until touching a support where a rise cycle begins again.
A trader using technical analysis tries to anticipate the evolution of the trend to take advantage of it.
In my opinion, the use of the internal market to perform trader activity has its advantages and disadvantages:
ADVANTAGES:
- No fees per order.
- There is no leverage, so the risk of losses is limited when the price trend goes against you (this also limits profits)
- It is simply exchanging STEEM and SBD
DISADVANTAGES:
- It is a small market compared to external markets and is therefore more manipulable by its more experienced players.
- There is no a chart with the price in real time so you have to create it yourself since the depth chart of the order book is not very suitable for efficient trading.
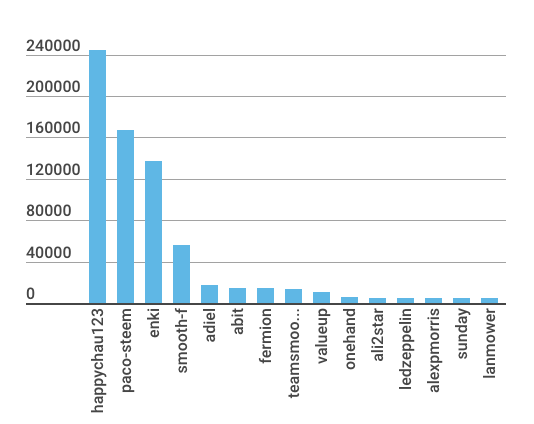
3.2.5 THE MOST ACTIVE PLAYERS IN THE MARKET
To analyze the most active accounts in the market in different parameters instead of obtaining the TOP 15 for each parameter I have selected the accounts with the highest number of filled orders and then I have used these 15 accounts to show the rest of the ranking for the other parameters
In this way, the existence of different strategies carried out by different users is demonstrated, which I think is much more interesting than many different account lists
Regarding the number of filled orders, the main players are
1. happychau123
2. paco-steem
3. enki
4 to 15: smooth-f, adiel, abit, fermion, teamsmooth-mm, valueup, onehand, ali2star, ledzeppelin, alexpmorris, sunday, lanmower.
TOP 15 ACCOUNTS PER NUMBER OF FILLED ORDERS
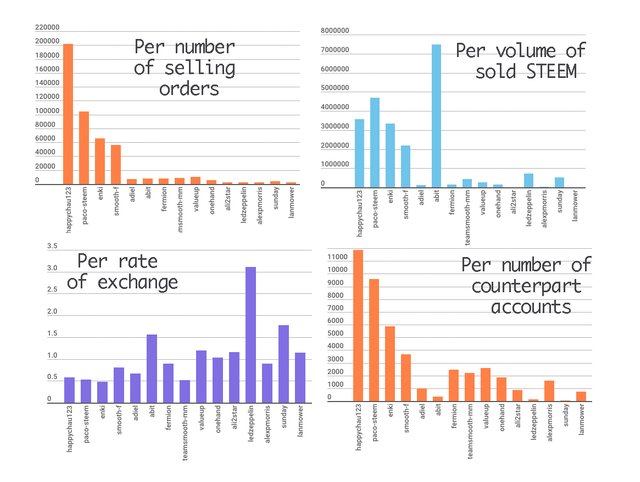
I have separately analyzed their behavior as buyers and sellers by calculating the number of selling and buying orders, the volumes of STEEM handled, the average ratios obtained and the number of unique accounts (counterpart) with which they have interacted
ACTIVITY AS SELLERS
ACTIVITY AS BUYERS
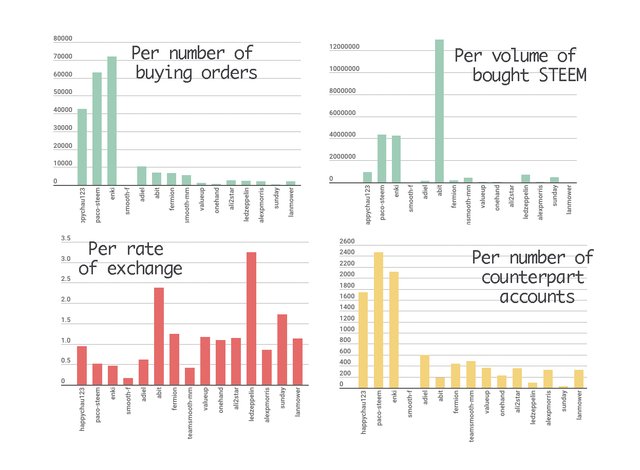
Trying to simplify the analysis of these graphs I have reached the following conclusions:
- You could divide the players into two different groups:
Professionals Players
Who have had and continue to have a consistent, intense and daily trading activity, adding small profits due to small percentages changes of the price, interacting with many other accounts, mainly selling STEEM (and possibly buying it in the external market). These players are 4 (of the 15 selected) @happychau123, @paco-steem, @enki and @teamsmooth-mm
The magnitudes of the number of orders suggest the use of a semi-automated system to make trading decisions and perform operations.
I do not think it's about what we call bots that act automatically all the time once they are programmed since their activities seem discontinuous probably because they require human supervision. However, I think this is a favorable field to use something like a high frequency trading bot.
Opportunists Players
Who have had sporadic and sometimes very striking activity, such as @abit in the high volume of STEEM bought and sold, the high rate of exchange as @ledzeppelin or the small number of counterpart accounts in their operations as @sunday.
- The activity of these players, which has been important at times, moves away from trading activity and may be related to the need to convert between types of tokens, which does not exclude that they have had some profits or losses from the point of view of trading activity.
5. SOURCES, DATES & TOOLS
DATA SOURCE
I have used SteemSQL, a publicly available Microsoft SQL database containing all the Steem blockchain data held and managed by @arcange.
ANALYSIS SOURCES
- Internal vs. External Market Trends
- Internal Market Participants & Transaction Trends
- Internal Market Trend In Relation to SBD/Steem Price Swings
- The Arbitrage Sabotage Steem-Dollar Teeter-Totter
DATES
- Scope of the analysis 2016-07-04 to 2018-06-26
- Submitting date 2018-07-11
TOOLS
Hi @lokomotion, great introduction to the internal market workings before even starting with the analysis part!
The strong rise in the number of orders and users is likely coming from condenser dropping the direct conversion option in combination with the high SBD price in mid of Dec. 2017, so a lot of users converted their SBD to STEEM via the market.
Do the cancelled orders also include expired orders? I think the the steemit GUI currently only supports non-expiring orders, but setting an expiry date is possible from other interfaces.
The "professional players" you found are indeed well known names for anybody that ever used the internal market. I also think there's quite a lot of automation included. Very interesting topic, too little time ;)
Your contribution has been evaluated according to Utopian policies and guidelines, as well as a predefined set of questions pertaining to the category.
To view those questions and the relevant answers related to your post, click here.
Need help? Write a ticket on https://support.utopian.io/.
Chat with us on Discord.
[utopian-moderator]
I have considered the canceled orders (in the LimitOrders table) simply when cancel = TRUE so they do not include the expired orders.
The issue of the expiration date took to me a few hours as I found expiration dates on the same day of the creation of the order, 5 and 7 days later and other very strange dates such as 31-dec-1969 or 29-October-2035 and I assumed that this diversity, as you say, was due to the use of different applications or different configurations of the user's profile.
As I was not sure of interpreting this information correctly, I chose not to include it, especially because I thought it was more important to focus on the analysis of the filled orders.
Thanks a lot! @crokkon
Hey @lokomotion
Thanks for contributing on Utopian.
We’re already looking forward to your next contribution!
Want to chat? Join us on Discord https://discord.gg/h52nFrV.
Vote for Utopian Witness!