LTCUSD - Technical Analysis October 6, 2017 - Current Price $52.64

LTCUSD
We have been watching LTCUSD for signs of life, recently it had backtested a breakout and is trapped in a kind of no mans land where we are observing some bearish moving average convergences on the intraday timeframes. Without buying pressure LTCUSD can remain trendless for sometime, however, if BTCUSD continues to trend upwards it should begin to lift the broader crypto market.
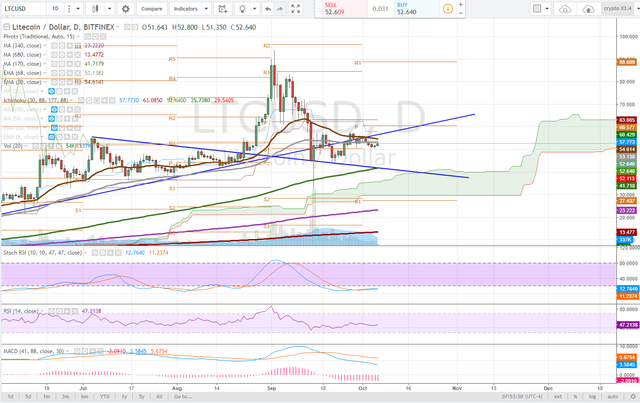
daily
On the daily timeframe, we are observing this trendless price action with the stochastic RSI still in downtrend and the MACD yet to even show us signs of momentum.
The price has been so stagnant that the down trending RSI on this time frame has begun to flatten. Resistance is being observed at the 68ema and the first step towards meaningful price progression would be to recapture this moving average.
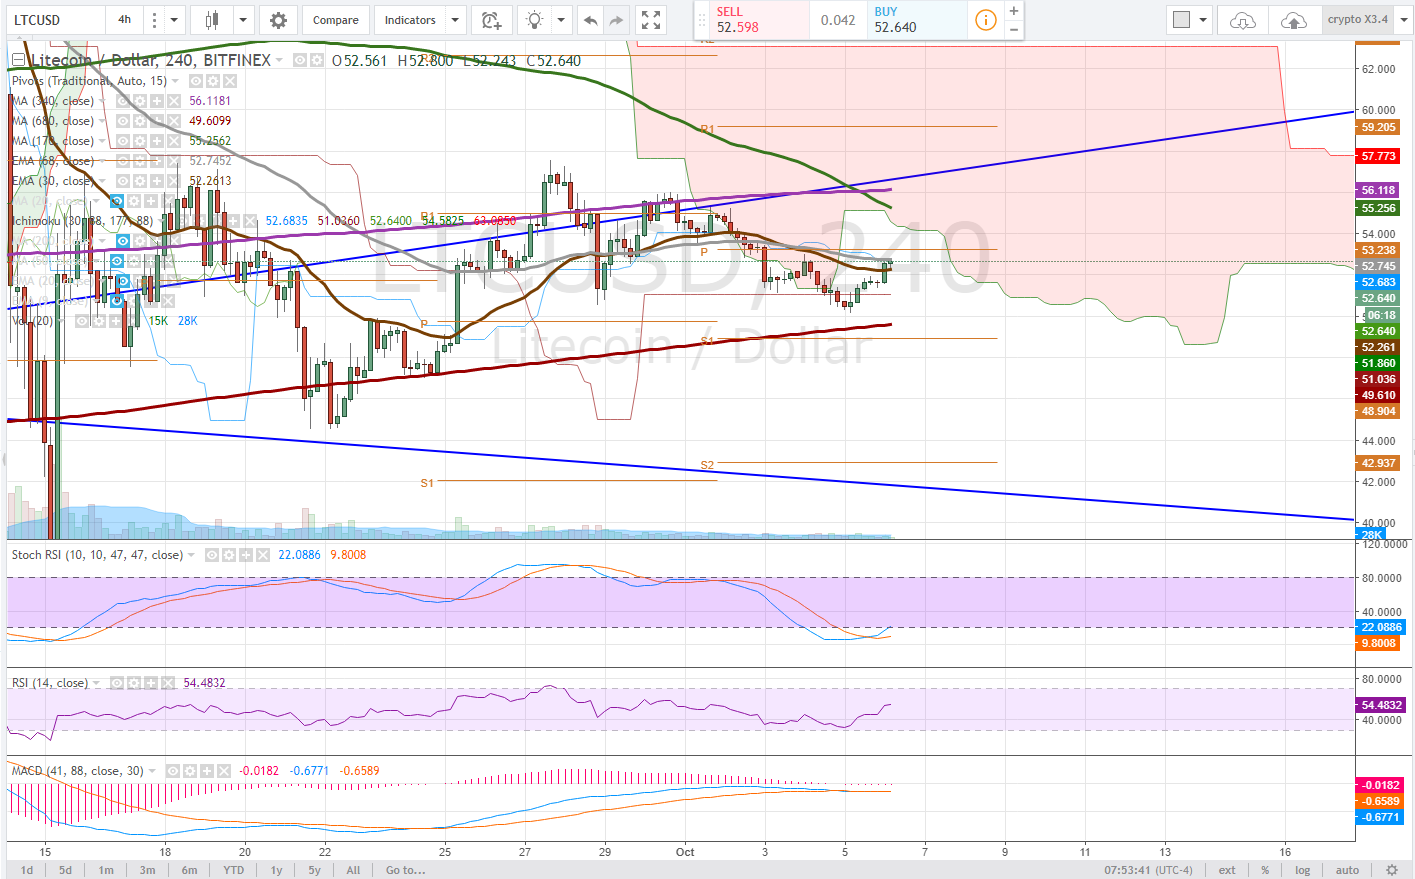
4 hour
The 4 hour time frame is a lot more interesting with the bounce and trajectory towards the pivot resistance on this time frame as we are observing the price make its way through the 68 ema to test the 30 ema. Recapturing moving averages and turning them from resistance to support is very conducive price action.
The Stoch RSI has given a bullish divergence but is still stuck in downtrend. Important to observe also is the flat MACD hanging at deviation zero.
Price progression on this time frame will be observed if a higher high can be printed, above $53.03. Be aware of the bearish moving average cross that has occurred, the 170dma has fallen below the 340dma. Both will be tough resistance to crack.
1 hour
The Stoch RSI and MACD are cause for pause on the 1 hour time frame and suggest that the price could roll over 1 more time providing a dip buying opportunity for bulls if the price cannot break above the 170dma on this time frame to reclaim the 1 hour pivot.
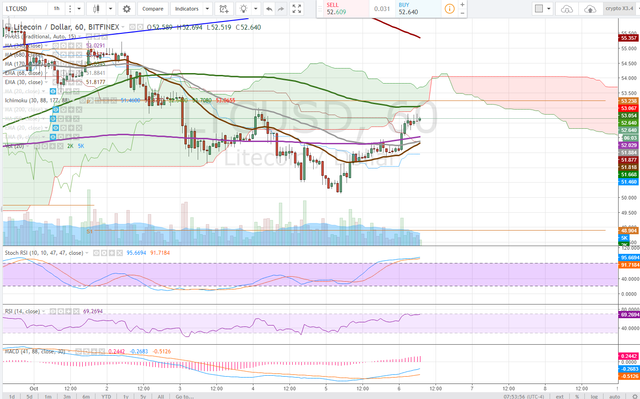
In otherwords, LTCUSD is trendless, the price action is neutral, I would not short or long here for holding. There is good Risk Reward on a day trade, but investors and swing traders should wait for direction.
Bullish Above: $55
Bearish Below: $49.50
RISK TRADE: Take a long position here looking for test of daily 30ema.
Don't forget to use stop losses!!!
Previous Articles:
ETHUSD
DASHUSD
ZECUSD
XMRUSD
BTCUSD
LTCUSD
U.S. Dollar Index
Follow at your own risk, Not a financial adviser, understand the risks associated with trading and investing. Manage your own Risk - in other words you could lose it all and it's your own fault.

Litecoin started well ... for the last two months done ziltch.. I see bitcoin is on the up very nicely now I hope they all follow.. Soonest. Cheers ;)
Thats exactly the correlation im looking to observe, whether it still exists and how strong it is. The interesting thing about crypto is that in theory BTCUSD shouldn't actually drag up the entire market as cryptos are priced in it - but it does. If we begin to see that correlation wane, i would suggest that we are seeing fundamentals work more on price action rather than pure exuberant sentiment.
This is good... Cherrrrrrrrr bit coint.. :D
Congratulations @satchmo, this post is the most rewarded post (based on pending payouts) in the last 12 hours written by a User account holder (accounts that hold between 0.1 and 1.0 Mega Vests). The total number of posts by User account holders during this period was 967 and the total pending payments to posts in this category was $969.56. To see the full list of highest paid posts across all accounts categories, click here.
If you do not wish to receive these messages in future, please reply stop to this comment.