Cryptocurrency prices analysis and forecast – 28 November 2018

BTC/USD
BTC/USD is being traded at $3,812 and continues to move sideways with the advantage of further decline. Another news about Bitcoin ETF, this time positive, visited the market. First, the SEC Commissioner Hester M. Peirce, as part of the "What Bitcoin Did" podcast, confirmed the inevitability of accepting this ETF. Secondly, anonymous sources at Bloomberg reported that Nasdaq is preparing to start trading Bitcoin futures and has already aligned its product with the CFTC rules. So, perhaps, we still see the long-awaited Bitcoin ETF in the nearest future. All this can give grounds for the beginning of the development of correctional growth, which was not the case during the entire fall of the coin from November 14. In general, the market situation continues to be not the best. Assets remain in the oversold zone, and the correction of the entire market as a whole, and Bitcoin, in particular, remains only a matter of time.
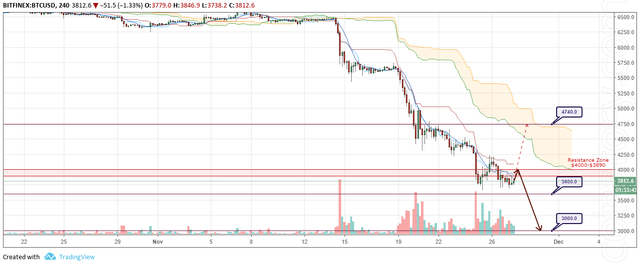
BTC/USD Forecast and analytics 28 November 2018
As part of the forecast for November 28, we can expect the continuation of the current correction and a bearish trend. So far, the coin is trying to find support in the area of $3,750 - $3,600. However, neither the volume nor the strong price movements are not happening. If we look at the weekly chart, the price almost came to 200MA, the stronger support zone is at $3,300 - $3,150. Earlier, an attempt by buyers to expand the price choked on $4,200. Therefore, a more likely scenario is the next test of the signal area of $4,000 - $3,890 and a departure to 200MA at $3,150 - $3,000.
The alternative scenario is the active development of upward correction with a target of $4,740.
ETH/USD
ETH/USD is being traded at $108.71 and continues to decline. Over the last trading day, the coin has updated the minimum of the whole fall. The new mark was $102.20. The previous low was at $102.96. This update cannot be called significant, but thus sellers remind of themselves, and of their intention to move the price even lower. Market participants actively sell the coin as soon as it reaches the signal area, where the marks are more attractive. They are pushed to this by fears that the cost may fall sharply again. Therefore, in the near future, the downward trend is likely to continue.
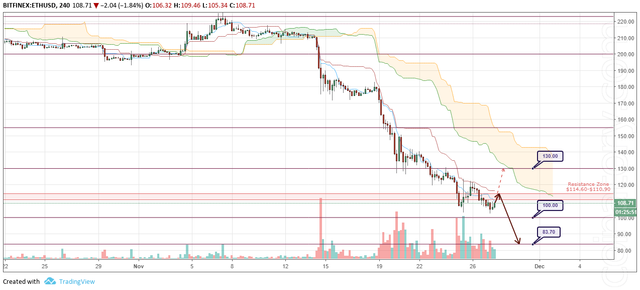
ETH/USD Forecast and analytics 28 November 2018
As part of the forecast for November 28, we can expect the continuation of the downward movement. The price balance zone is located at $114.60 - $110.90. In the case of its testing and rebound, as well as the formation of bearish signal patterns, we can expect a further fall, to the levels of $100.00, $89.00, $83.70. And in the case of the development of corrective growth and the breakdown of this area, the goal will be the mark of $130.00.
XRP/USD
XRP/USD is being traded at $0.35617 and continues to correlate with Bitcoin, trading sideways. The coin continues to follow the bearish trend in both the short and medium term. After the recent correctional growth, the coin is trading in a constantly narrowing range. Given the nature of the price behaviour inside it, it is more likely that this accumulation will break down. Therefore, in the near future, we can see the renewal of the minimum of the whole fall and the departure to the $0.31000 mark.
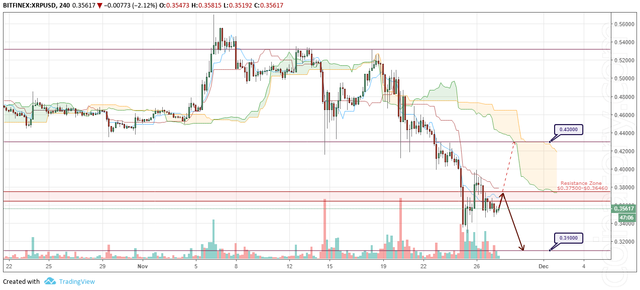
XRP/USD Forecast and analytics 28 November 2018
As part of the forecast for November 28, we can expect the continuation of the current consolidation with the advantage of a further fall. The signal area is the zone of $0.37500 - $0.36460. This area can be tested once again before a new wave of decline. In order not to miss the moment of the end of consolidation, it is necessary to monitor the formation of bearish signal patterns in this area. In the case of their presence and further rebound, you can wait for the fall, with the goal of $0.31000. And in the case of the development of correctional growth, the target will be the mark of $0.43000.
XMR/USD
XMR/USD is being traded at $57.050 and is trading sideways. This coin has the properties to anticipate the movement of the entire market. Often it is on its chart that you can see the movement that other coins will start to implement in the future. Perhaps now we are seeing exactly this case. The coin, like Ethereum, for the last trading day, has not significantly updated the minimum of the whole fall. Now it is the first to show steady growth in the signal area. This area is notable for the fact that at the moment it is here where the levels of the so-called price balance are located. Levels, where it is not too expensive, and not too cheap, i.e. prices from which it will be profitable to buy and sell. Therefore, now we need to monitor how the price behaviour will be formed. If in the near future, we will see a confident development of the upward correction, then Monero will once again be able to confirm the status of the “insider” of the entire cryptomarket.
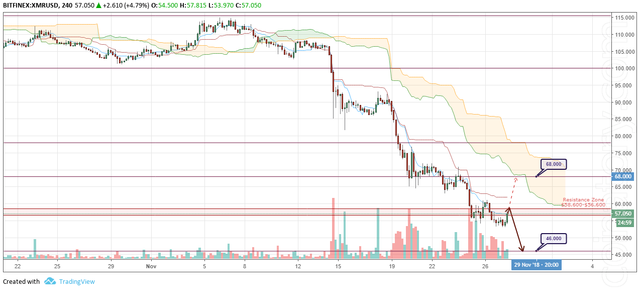
XMR/USD Forecast and analytics 28 November 2018
As part of the forecast for November 28, we can expect the continuation of the correction. Since at the moment the situation with the further price behaviour is not clear, the scenario for the decline remains in priority. Moreover, on the example of Ripple, we know that it is useless to argue with the market in the end. The signal zone is located at $58.600 - $56.600 levels. In the case of the formation of bearish signal patterns and rebound, we can expect a further fall, with a target of $46.000. And in the case of the development of strong correctional growth, the first goal will be the mark of $68.000.
Posted from my blog with SteemPress : https://coinatory.com/2018/11/27/cryptocurrency-prices-analysis-and-forecast-28-november-2018/