ETH/USD 7/28/2018- Triangle Break Soon?

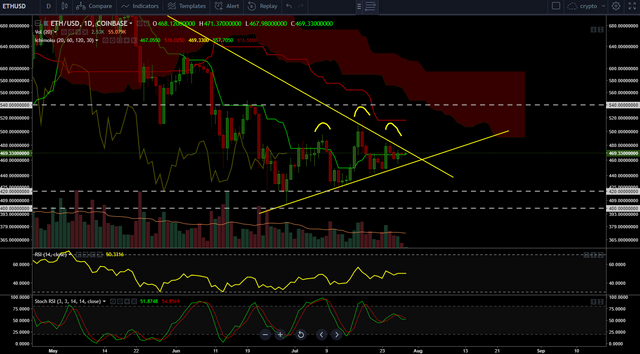
Daily

Well here we are at the edge of the triangle where the past several days have printed higher lows, but lower highs. From what I have seen on social media, there seems to be bullish hopefulness in the midst of price uncertainty. If ETH is to make a case for itself being bullish, now is the time for it to shine. However, we need to keep in mind we are very far from long-term bull trend indications. ETH price action remains far below the Kumo cloud and even the Kijun which remains above the Tenkan. The Tenkan has been seeing the most love with price action orbiting the line for several days now.
The next big step would be to jump to the Kijun at the low $500's and mellow out with some sideways action there for a short time. In order to do this, we need to break up out of this triangle in this candle or the next. A slowly ascending RSI shows promise with a neutrally placed Stoch.
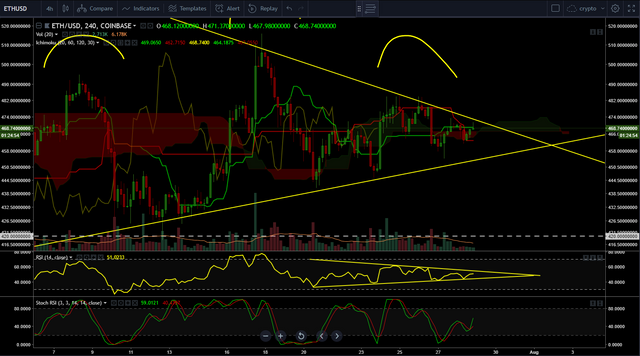
4-Hour

On the shorter time frame we still higher lows being printed. However, we see one successful rejection off the Tenkan/Kijun before the TK cross and a possible second rejection with this current candle. We also see a steady decrease in overall volume. The bullish TK cross for the first time in about a week may indicate a leg up being on the horizon out of this triangle. Again, a slowly ascending RSI may also give us a bit of momentum push. If we are to break up, expect resistance near the previous local high of ~$515 USD.
-Disclaimer-
This post is merely my own personal analysis and should not be taken as financial advice. I am not a licensed financial advisor. Always do your own research before making any investment decisions. Stay safe out there.
Upvote, Follow, ReSteem
Twitter: @CoinScholar_
Posted from my blog with SteemPress : http://coinsholar.vornix.blog/2018/07/29/eth-usd-7-28-2018-triangle-break-soon/