TFDSRE - The Essence of Equipotential Lines in TFDSRE Technical Analysis (#5)
Equipotential lines (EP lines) are moving averages but you can think of then as lines to where price on chart gravitates.
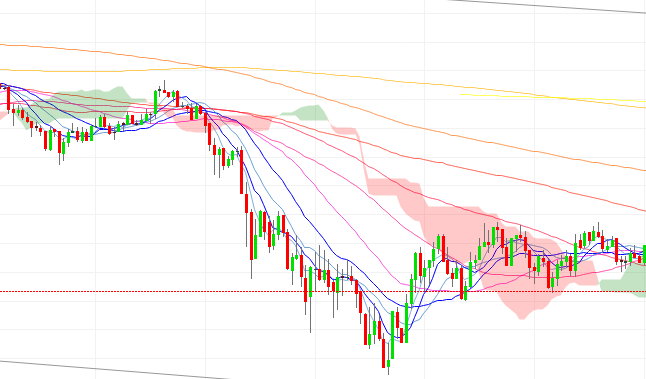
In my style of technical analysis I start to use moving averages as attraction lines. This lines attract price to return to them which is the essence of all arithmetical means. It had already been found that price tend to return to the moving average line and essentially oscillates around this line.
Further away price is from moving average line more potential energy posses and with greater momentum will move to meet moving average line (EP line) again. If momentum of price is to small to break through the EP line, price will stop at this line and EP line become resistance line. Price need some time sticking on EP line to come on the other side and oscillate in opposite side. This process is known as consolidation of price.
If momentum is even smaller price bounces from EP line and start new oscillation on the same side of EP line gaining potential energy for another approach attempt. If it gains enough energy to build enough momentum in the next attempt it manage to break though the EP line and repeat the process on the other side.
If we increase the number of frames included in moving average representing EP line we increase fractal scale of this line. Fractal scale is scale in which proportion a process of price movement according the EP line is observed.
If the number of frames (periods) is small we observing price oscillations in short periods of time (within hour or day period). If number of frames in moving average is big we observe price movement according to the long periods of time (week, month or even year). Fractal scale depends also from the size of candle period (sampling period in which price is recorded)
Smaller fractal scales is incorporated in bigger ones, which is within the fractal nature of price movement. This is the same principle as used in Elliott wave theory of price movements.
When we set up moving average periods in golden ratio proportions EP lines coincide with Fibonacci extension and retracement levels, so they can be used for setting price targets as well.
For more check series of blogs about TFDSRE here: #1, #2, #3, #4.
Disclaimer: If you use my ideas and analyses in your investment ventures, you take all responsibility and consequences about your actions.
And as always upvote this post and previous ones, if it have some value, follow me, if you think this content is great and I promise that it will be more interesting stuff in the future. Let steem on, to the bright future!
What are the period of ma u using? and also their type. sma wma or ema?
I use periods in Fibonacci (5,8,13,34,55,89,144,233, ...) or Lucas numbers sequences. More detail explanation you can find here @.
Check my new analysis of btc here https://steemit.com/bitcoin/@mazharkazmi/bitcoin-current-situation-from-technical-point-of-view-bearish-signs