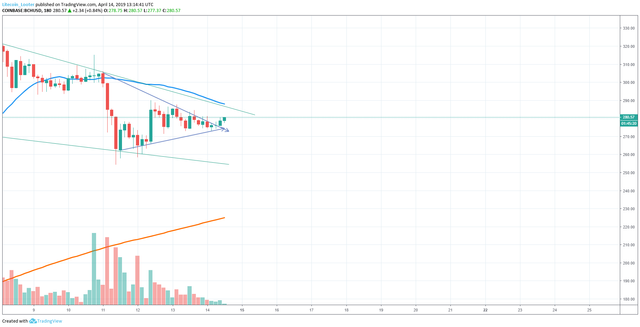
BCH 3 Hour chart
A couple days ago I posted a chart I was messing around with of BCH and it is a three hour chart and now here is the updated chart from then.

It did break through the top of that triangle but now what I want to see is it break through that green line and get out of that channel. Like I said before I am just starting to try and get into all this charting again, if someone knows a lot about this kind of stuff hit me up and let me know some better things to look at.
Bitcoin Cash Address.

