Belacoin Technical Analysis March 2017 to March 2018
Price charts of BELA using Coinigy Charts, traded on Poloniex.
Starting with the oldest price reviews and moving to the most recent chart patterns. Technical Analysis screenshots provided by DigitalCurrencyTraders.com
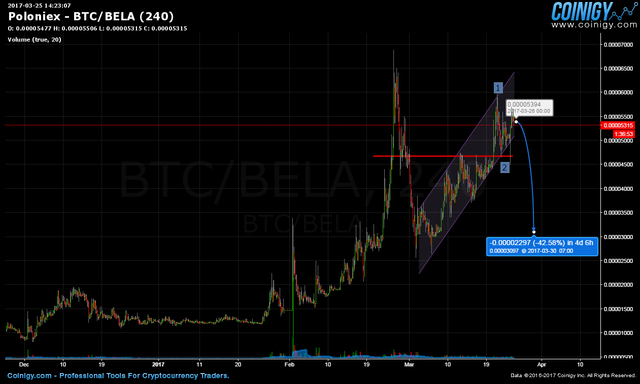
March 25 2017
I was predicting a top formation in BELA, and that prices would retrace - this was not to be the case.
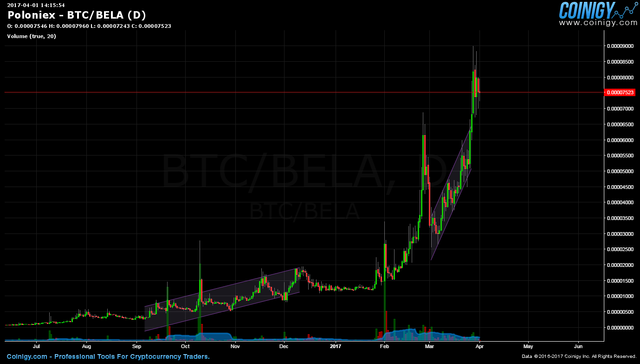
April 1 2017
One week after the march top formation prediction, April 1 2017, prices had surged to new highs as all the altcoins had started a bull run.
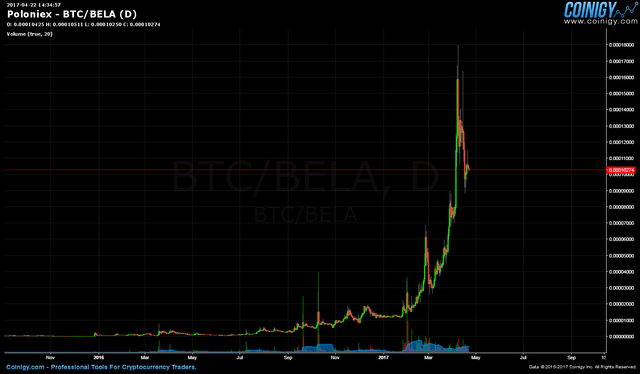
April 22 2017
Another three weeks later we can see here on April 22 2017 that prices had spiked and already retraced. Long out of my trading patterns, these times are all sell moments for me.
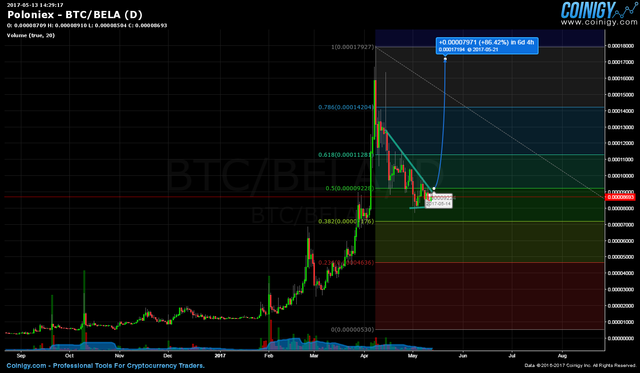
May 13 2017
May 2017 the majority of altcoins were in strong bull moves, and this consolidation appeared to be a mid-term bottom and I was calling for more strength from this point.
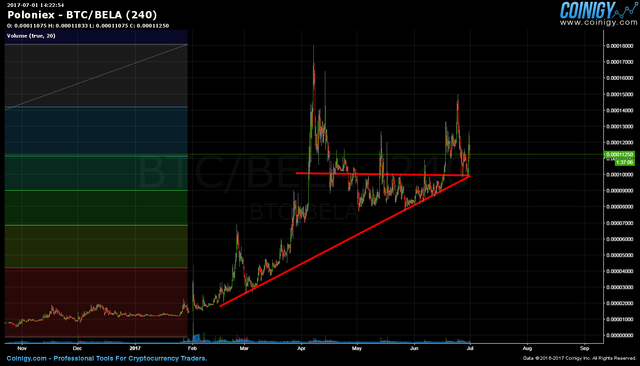
July 1 2017
More price strength had occurred through june, but by July 1 prices had not made new highs - the trendline along the bottoms became a key exit point later, but at this time I was calling this pattern support in the uptrend.
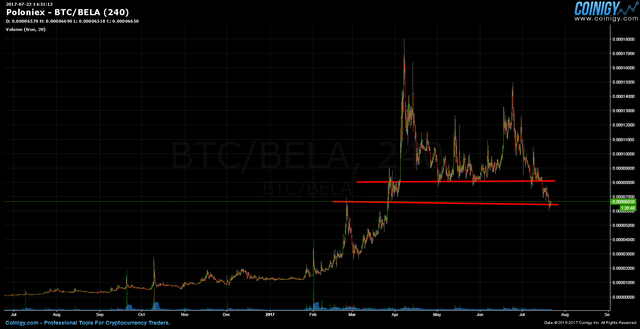
July 22 2017
A couple weeks later in late July and we can see where the previous trendline along the bottoms (from feb to early july) was indeed a clear exit signal. At this time I am reaching back to historical price levels trying to establish where support will hold and the bull will return... an error.
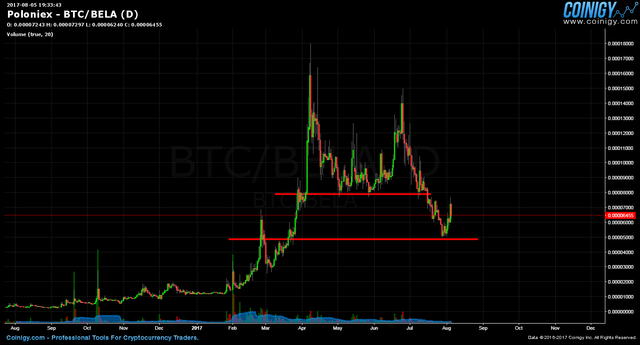
August 5 2017
Early august 2017, the late july support levels did not hold, and the new low became a search for the support in the charts - which did not hold... in hindsight we know now that all the alt markets were in a bear market and prices were clearly trending down, not staging at support levels and preparing for a reversal.
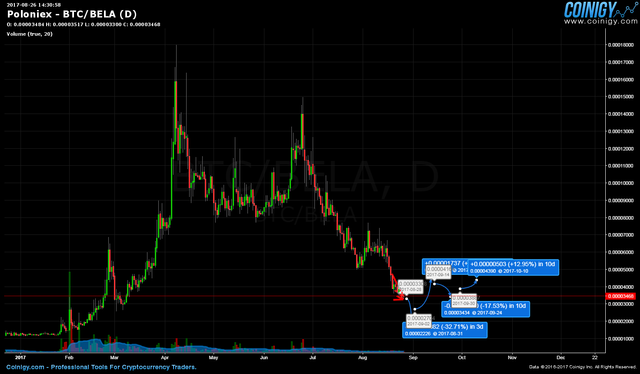
August 26 2017
Late august and the down trend continued - each time a hesitation in the prices set up, I was seeking to point out the return of the bull market... but it was not to be at this time.
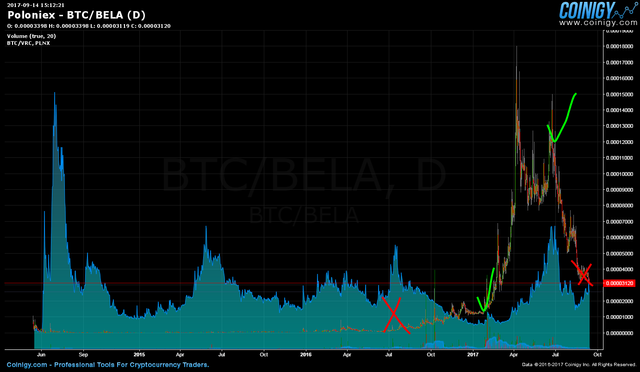
September 14 2017
Sept 2017 - in a review of all the poloniex charts, I was searching to identify those markets that met four criteria that was to indicate which markets were going to turn around first. While a good methodology for studying charts, I was only looking for the return of the uptrend and not considering the possibility of the down trend ongoing.
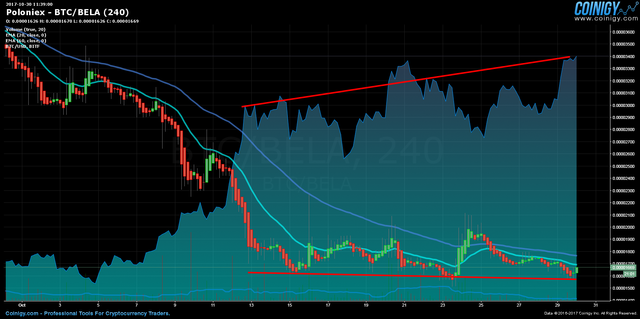
October 30 2017
Late October, price have hit a low three times since mid October and the drop in prices of BELA compared to the rise in BTC - became another search for when the alts would turn around and start to rise WITH bitcoin.
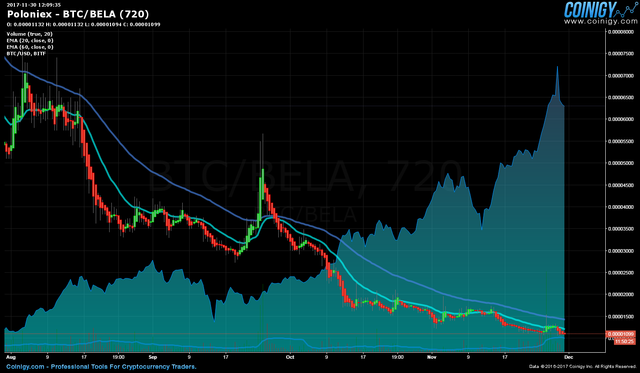
November 30 2017
Late November and we can see the lows in October did not hold. While the trend is still down, it is not as proportional as the rise in Bitcoin. The charts are not showing a nice bottom formation, the 3 month EMA has not crossed and the down trendline had not yet been breached.
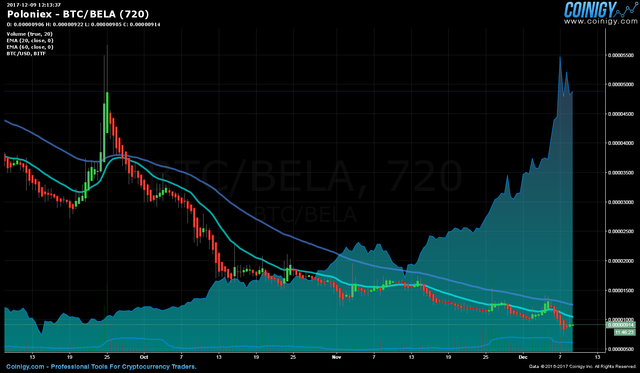
December 09 2017
Early December of 2017 - the november lows did not hold. Bitcoin makes new highs. In hindsight we know now that these lows in BELA were the bottom. And yet, this chart is not a buy signal in our Simple Trading Plan.
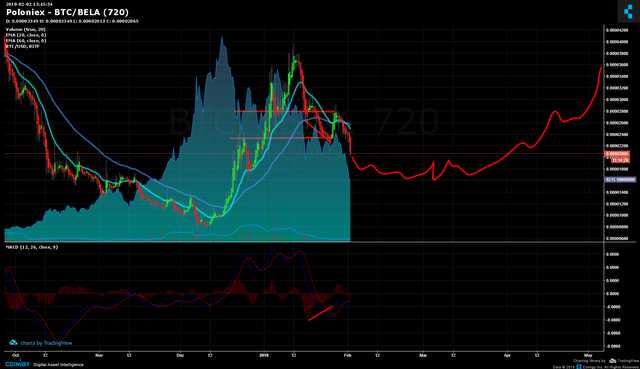
February 2 2018
February of 2018 - we can see the price surge that occurred between Dec17 and Jan18 - a top formation is now in place, and this chart shows a longer timeframe prediction of prices moves over the months to come. As it turns out, this chart was not bearish enough.
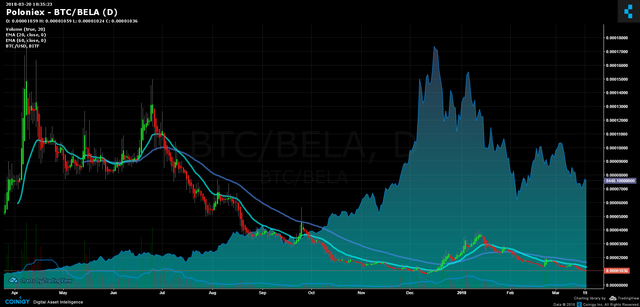
March 20 2018
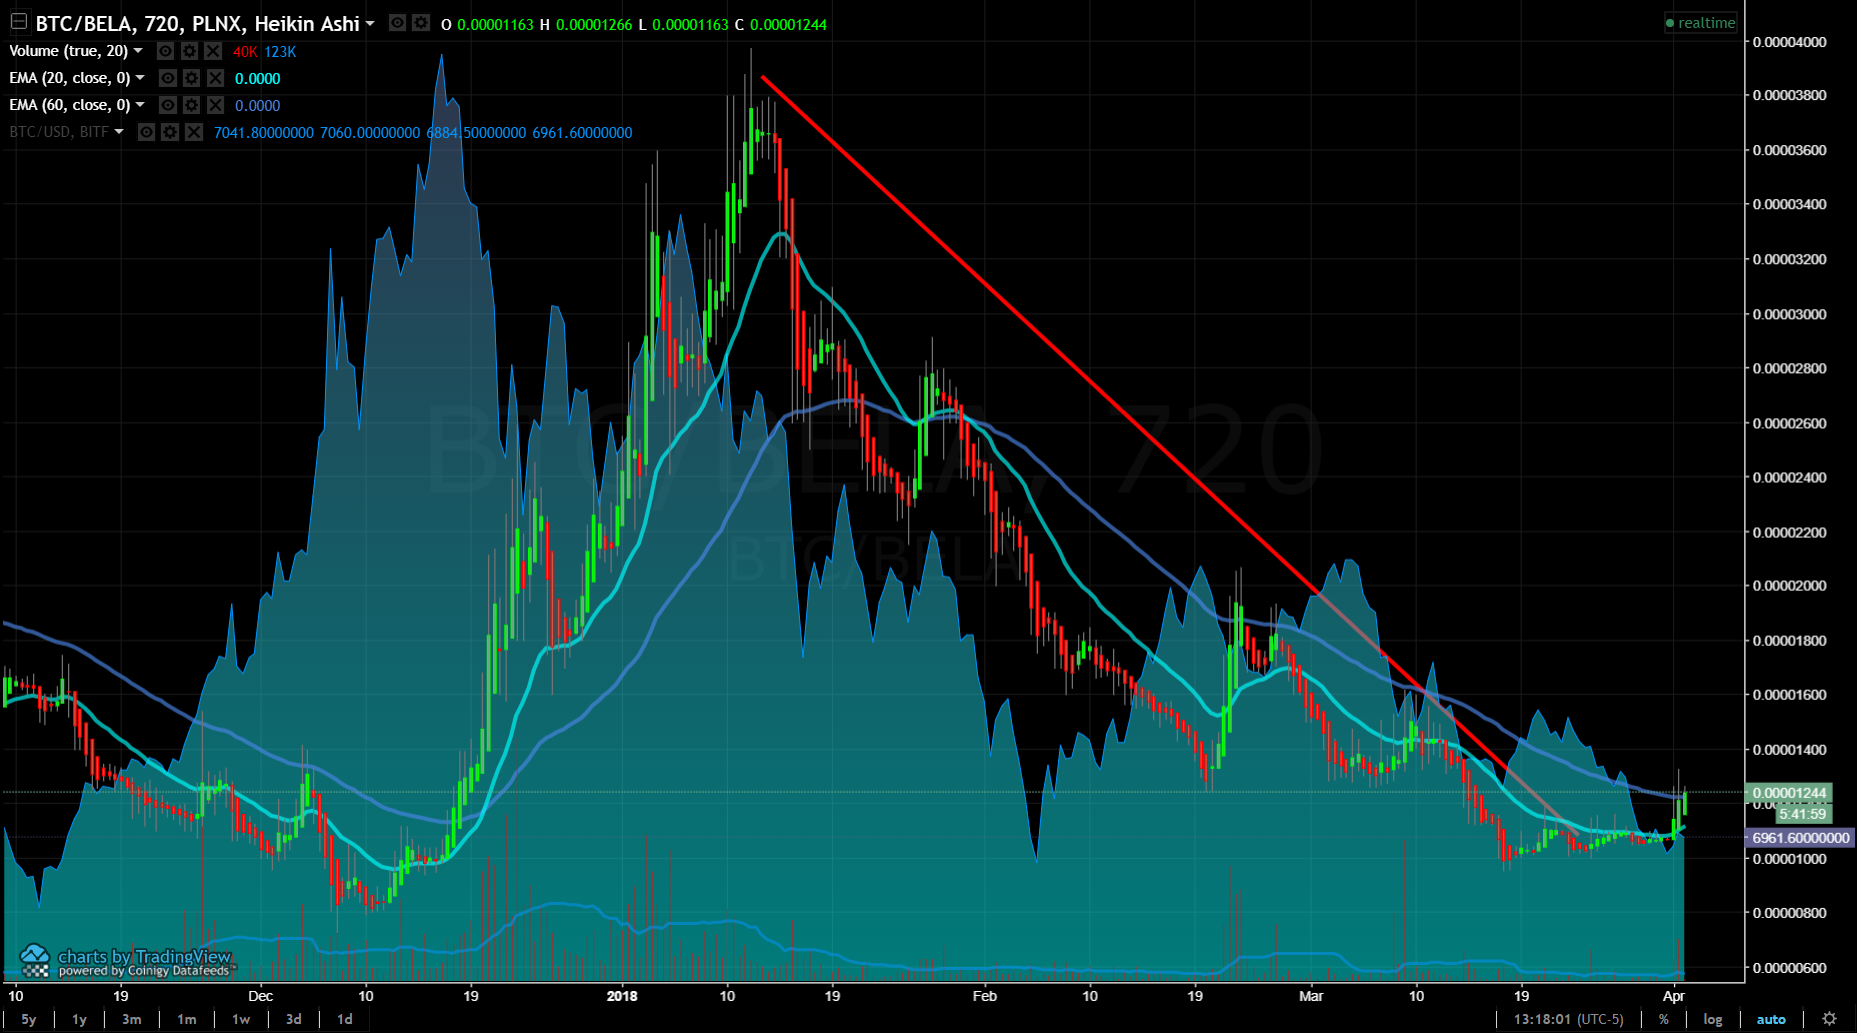
March 2018 -- 1 year chart with daily bars - the february predictions were close, but did not expect prices to slide as far as they are in this chart. Still time to be watching for the three signals!
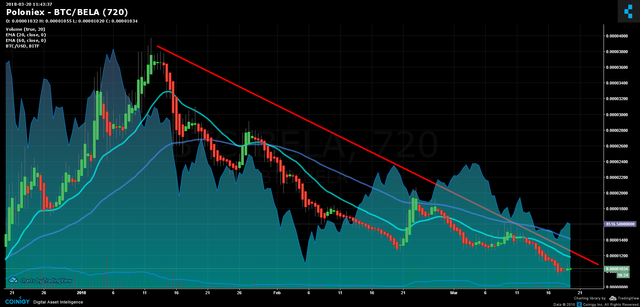
March 20 Three Month Chart
March 2018 - three month chart showing trendline has not been broken - we do not have a 1-2-3 bottom in place, and the 3 month EMA is not showing a reversal. Still time to wait for a better trend change before our Simple Trading Plan will give us a buy.
Conclusion
Belacoin price chart is lining up at ideal price levels near historical lows, but has not yet completed the required signals to become a buy when reviewing against our Simple Trading Strategy.
Expect to see the down trendline broken, followed by a confirmed 1-2-3 bottom AND the three month EMA crossover - all three signals combined become a place to establish the first part of a speculative position.
---
Also find
AMP - A Year of Synereo AMP Price Reviews
I can see a great potential in you. Consider folowing me back 🙂👍
Stay tuned - there will be reports on every market traded on Poloniex. These analysis were performed over three years, but only the past year using screenshots from coinigy charts.
This follow up image is showing the potential for this bottom formation to prove itself with all three signals: The trendline has already been broken, the 1-2-3 bottom formation breakout is confirmed, and now we are waiting for the 3 month EMA crossover.