Investing: Calling Prices Vs Dollar Cost Averaging
NOTE: I am not a financial advisor, professional investor, or a fiduciary of any kind. Invest at your own risk. Nothing in this post should be taken as investment advice. This post is only for the purpose of informal information sharing since people as me quite frequently to tell them "what my price target is" for various assets.
Eleven years of investing, the last 4 being active day trading, have solidified the following truths:
- Predicting exact price targets is game of speculative luck (the only people with magic knowledge of exact bottom and top numbers are whales who force the market to move in one direction or another at a moment's notice)
- Over time, fixed supply assets (that have long term value) appreciate in value in relation to unlimited supply assets -- and I don't just mean limited supply assets like gold/bitcoin compared to fiat currency; stocks that reverse split are toxic (arbitrarily creating supply and dumping it on the market is akin to declaring the asset worthless)
- When a stock issues a reverse-split, buy PUT options
- Dollar-Cost-Averaging (DCA: buying a fixed dollar amount of any long-term appreciating asset) wins out against all investing strategies aside from pure dumb luck
- The right time to buy is always once each week, in a fixed dollar spend
- Large investment sums (e.g. you got a $10K bonus you want to drop into investments) are best held until the market price is at or below your DCA cost-basis (to reduce your DCA cost-basis)
- The right time to sell is always when it would be profitable
- Exactly when to sell is mostly dumb luck, but can be optimized as the market rate trends toward a parabolic uptrend, after all DCA participants are in profit zone
Dollar Cost Average on Bitcoin
Here you can see that if you were buying any fixed dollar amount of Bitcoin since Jan 1, 2017, you'd be up ~92% right now assuming you didn't decide, arbitrarily, to sell somewhere in the hype bubble. If you did, you'd be up a lot more:
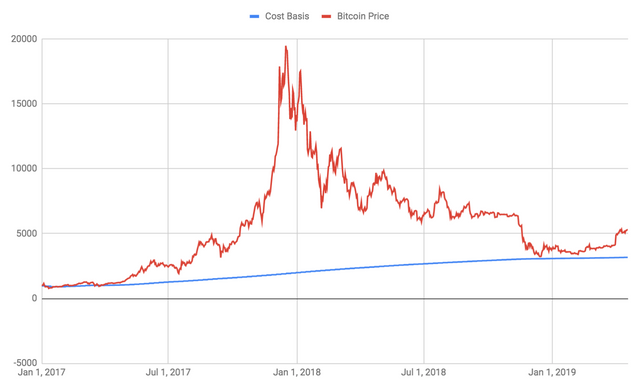
Here's the spreadsheet that built this chart: https://docs.google.com/spreadsheets/d/17HrkxVrq26dgBNuHBvN1vPtpQIkaZv0f1LG4XyLX47o
But this manual spreadsheet driven evaluation has limits. Wouldn't it be nice to see what it would look like if you starting dollar-cost-averaging 30 days ago, and 2 months ago, and 1 year ago, etc?
I've made up a PineScript indicator to show Dollar Cost Average Cost-Basis on any asset, on any timeframe, for multiple period durations (30, 60, 90, 120, 180, etc). This is the primary indicator I use to determine when it would be good to sell.
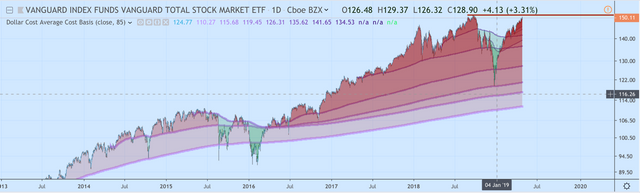
- The indicator shows dollar-cost average participants who have been doing DCA for various durations
- When the current price is profitable for the DCA plot, fills RED
- When it will reduce the cost-basis for a DCA investor to buy more, turns GREEN
- Draws heavier support lines for longer term DCA investors
- Intensifies colors to show where larger pools of players stand with DCA profitability
Bitcoin DCA Indicator Snapshot
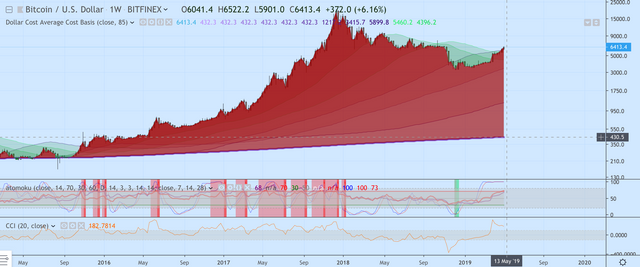
A long term uptrend for long-term DCA participants is a healthy indicator. A consistent RED area over time is even better (it means people are generally in the money when invested in this asset using DCA).
Also Useful for Knowing what NOT to buy
Since Dollar-Cost-Averaging is the best strategy, any asset that performs poorly when measured against a DCA strategy is a failing asset that I do not want to buy. Here's an example of $KHC, which I made the mistake of buying before I developed this indicator, thinking it was at a bargain price:
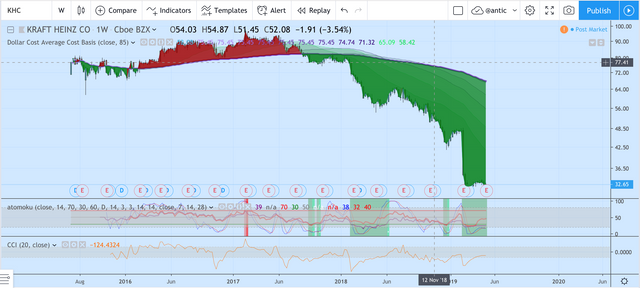
If the oldest DCA participants are at a heavy loss, it could be that the asset is at a great value opportunity, but more likely it's a poor investment that is trending toward zero.
Source code: https://github.com/atomantic/pine_scripts
Indicator: https://www.tradingview.com/script/kL0PXwBW-Dollar-Cost-Average-Cost-Basis/