BTC Trading in a Channel
Hello Steemians! I talked about BTC trading in a hourly channel in this post. It is still doing that. Let us have a look:
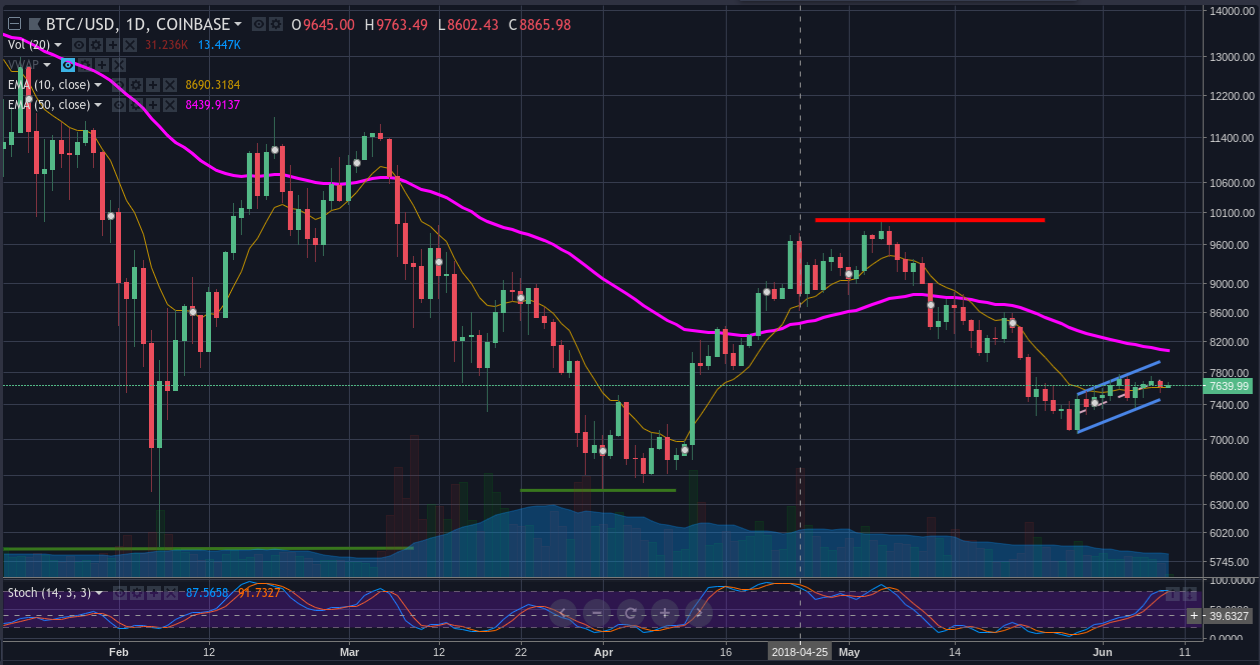
In the daily chart of BTC shown above, the price levels are well defined. Near term, we have 10K resistance above, defined by the early May highs; and 6400 and 6000 levels as support, defined by the early April and early February lows respectively. BTC have been trading within these levels basically all this year so far. Since our days of parabolic moves are gone, we must adjust the trading style and look for different patterns. Now trading is more conservative, therefore channel set ups are reasonable.

In the hourly chart above, the channel is well defined. With the help of stochastic, the lows can be bought and the highs can be sold depending of traders time frame. One area of concern that I see is that although there is an uptrend within this channel; prices are hovering along the lower half of the channel for the last 3-4 days. If there is no push towards the upper half of the channel, then there is a potential risk of breaking down. Then it will look like a perfect bear-flag breakdown on the daily chart.
Disclaimer: This is NOT professional advice, this is all just my own opinion and experience. I am NOT a Certified Financial Adviser. Consult professionals for any financial, accounting or legal related questions you have.
Charts are created in Tradingview.com, which is a free service
Go here https://steemit.com/@a-a-a to get your post resteemed to over 72,000 followers.