How to Make Money Trading Bitcoin (Part 1)
With the current good news surrounding widespread adoption of Bitcoin and the somewhat relaxation in volatility. I understand that there are a lot of new comers entering the Bitcoin community. Over the next 5 days I will be showing people how to trade Bitcoins. Everything from how to read charts (which we'll cover today), to how to make educated predictions about the market. We will only be covering the basics; just enough to get your feet wet. There is a lot to learn about trading and markets. Everything stated here is just advice, I am not recommending you to do anything with trading, just friendly advice. Do your research and due-diligence and never invest more than you're willing to lose.
Before you start trading Bitcoin you have to first understand what Bitcoin is. Of course Bitcoin is a cryptocurrency, but because cryptocurrencies are so new and the lack of general knowledge about them makes it difficult to trade them as such. In my opinion there are two ways one can consider Bitcoin when trading: a commodity (gold, silver) or a fiat currency (Dollar, Pound, Euro). This makes it easier to trade because you can look at it like you are trading in a Forex market (i.e. buying and selling dollars for euros or vice versa). This also allows you to see your financial gains and losses easier, as well as keeping everything simpler.
First things first, before buying or selling you must know what the price is. There are many great indexes to see the price, here's a couple:
http://www.coindesk.com/price/
http://winkdex.com/#/
After you know the price, you need a place to buy and sell your Bitcoins. There are some good and not so good options out there, here are a few that we like:
https://www.bitstamp.net/
https://www.kraken.com/
https://www.coinbase.com/
Word to the wise, do not put more Bitcoins than you're willing to lose in any exchange!
Once you have created and funded an account in one or more of the exchanges, you need to learn when to buy and sell. This is where it gets complicated for newcomers, but don't fret, we'll help you every step of the way. To know when you need to buy or sell you have to have an idea of what is happening in the market. Whether the price is rising or falling, if we are in a bearish market (down trend) or a bullish market (up trend), etc. To find out this information you have to look at market data or charts as their called in the investment world. Here are a few:
https://bitcoinity.org/markets
http://bitcoincharts.com/markets/
After you click, you are probably thinking, “......ughhhhh......I'm lost.” Don't worry, we'll walk you through it.
First thing you need to know is that there are generally three types of charts when trading.
Line charts (simplest, but don't tell you much) Bar charts (good, but they all become a blur after a while) Candlestick charts (most traders preferred chart and the one we'll be talking about) On bitcoinwisdom.com, click “Settings” then “CandleStickHLC” under chart style.
Candlestick charts, I bet you can guess why they are called that... Candlestick charts provide the most information possible in the smallest amount of space. Let's take a look at one and I'll show you how they work.
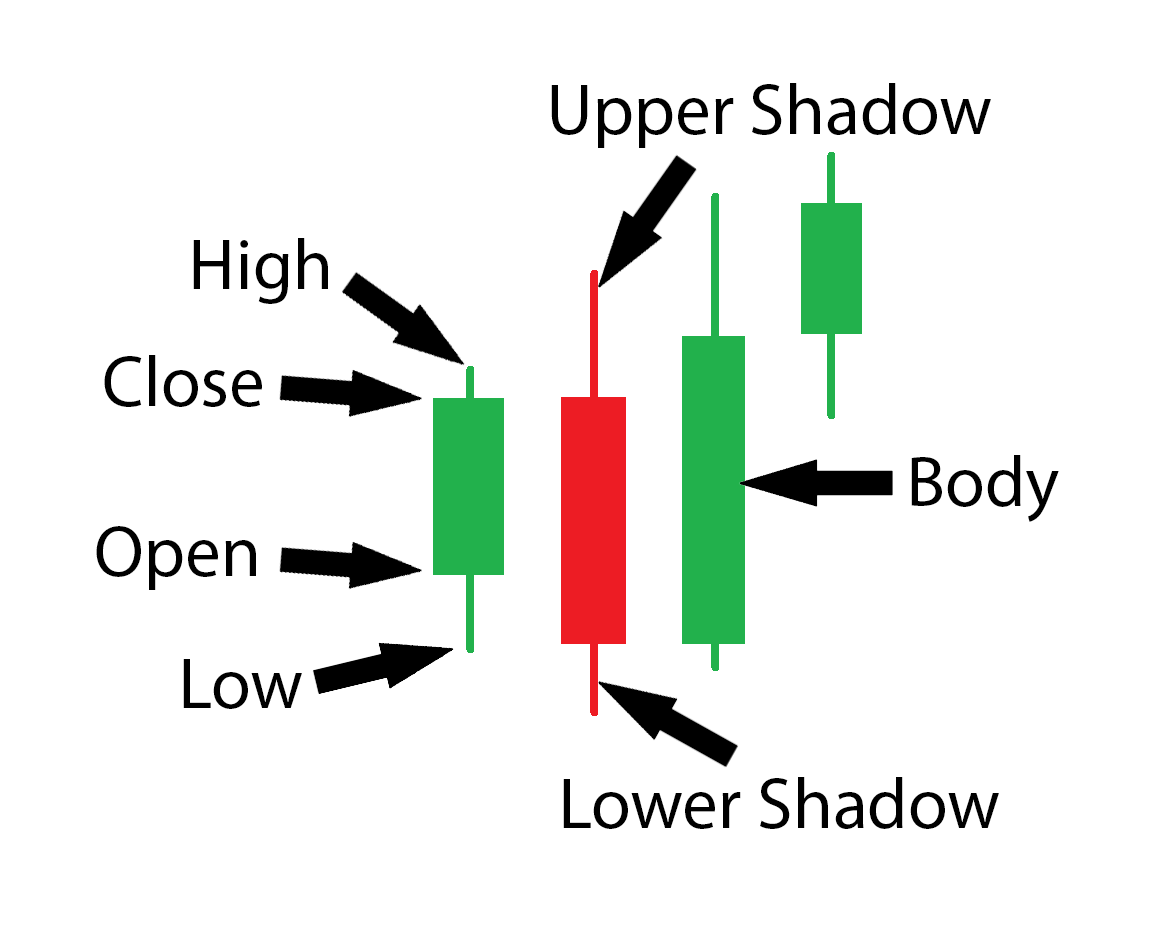
The individual candlesticks generally tell you 4 things. What the price was when it opened and closed. Also, how high the price became during the time frame, as well as, how low the price dropped too. If the candlestick is green, the open is on the bottom of the body and the close is on the top, showing that the price closed higher than when it opened. If the candlestick is red, the open is on top of the body and the close is on the bottom, showing that the price closed lower than when it opened. Where as the upper and lower shadows show us the difference between the high, the low, the open and the close. Now that you have a good understanding about Candlestick charts you can start to form an idea of what is happening in the market. If the chart is mainly green and going upward, we are in a bullish (up) trend. If the chart is mostly red, we are in a bearish (down) trend.
The second important thing is the time frame you are looking at. Each bar is a time frame. If you are look at a chart that is for 10 minutes, each bar represents 10 minutes on the chart. You can not day trade when looking at a chart that goes back for months and vice versa. For short term day trades you want to look at charts any where from 1 minute to 30 minutes. For long term trades you want to look at charts from 1 hour and up. At Cook Investment Firm we like 6 hour charts for our long term trades. Always make sure your chart is adjusted accordingly, you can make massive financial mistakes if it is not.
The third thing you want to pay attention to is the volume. You can find that at the bottom of the page. Here's a picture so you can see what I mean.
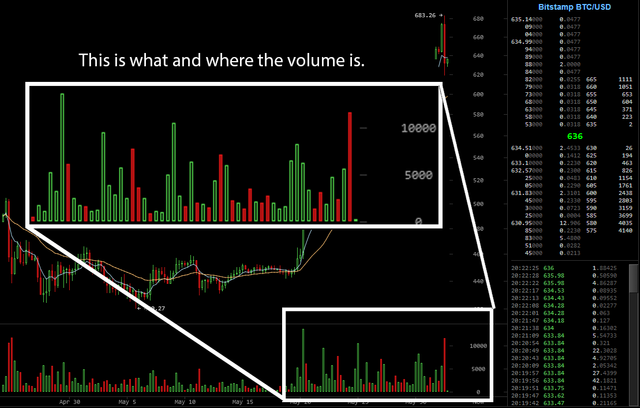
Volume plays a huge part in trends that are happening. It can tell you whether a trend is here to stay or if it is just a false trend. If the price goes up but there is very little volume to support it, odds are the price will go back down. However, if the price goes up and there is a high amount of volume supporting it. You have good reason to believe that the price / trend will stay. Volume can also tell you if the price is trending up or down. If the volume bar is green, that signifies the price is trending up or if the volume bar is red, that means the price is trending down.
Last thing you need to worry about when watching charts is the order book.
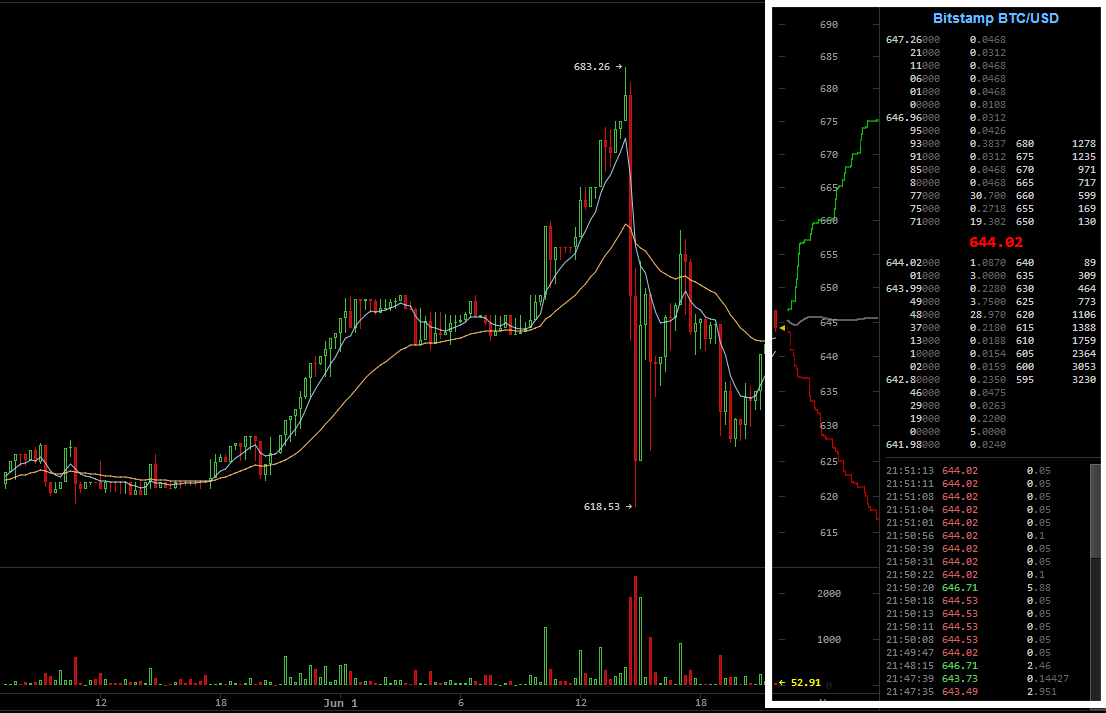
There are two parts to the order book, Bids (red / bottom) and Asks (green / top). The Bids are how much people are willing to buy Bitcoins for and the Asks are how much people are will to sell Bitcoins for. This is important to take a look at so you can see if someone sells 1,000 BTC where the price will fall to or vice versa. The order book also gives you a good idea of how much support the current trend has. If you see there are a lot less bids than asks. When someone sells a large quantity the price will change drastically. In a perfect world the difference between Bids and Asks should be equal (It would like a triangle), although, this is almost never the case.
(Follow Part2 Coming Soon!)