#Technical #Analysis: #Bitcoin and #Ethereum | Crypto Analysis
Bitcoin

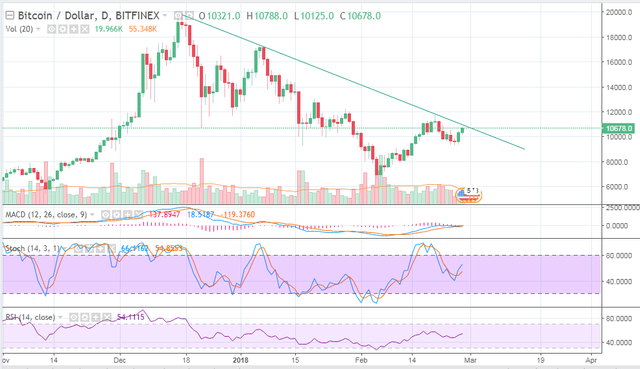
Stochastic and RSI, both are indicating an upside move in the counter.
The downward slope line in the daily chart is acting as an immediate resistance as it was also in the earlier two cases from where the prices fell. If it successfully clears above then next target will be around $11,760 level.
Bitcoin is continuing its bullish trend from the past two sessions and has crossed above the $10,400 level which offered a bit of resistance as it was also the 23.8 percent level in the Fibonacci scale of the recent up-move.
Note : Traders should take any fresh new positions, once Bitcoin clears its immediate resistance at the downward line and failing to clear will lead to further correction perhaps reaching $8,800 level.
Ethereum

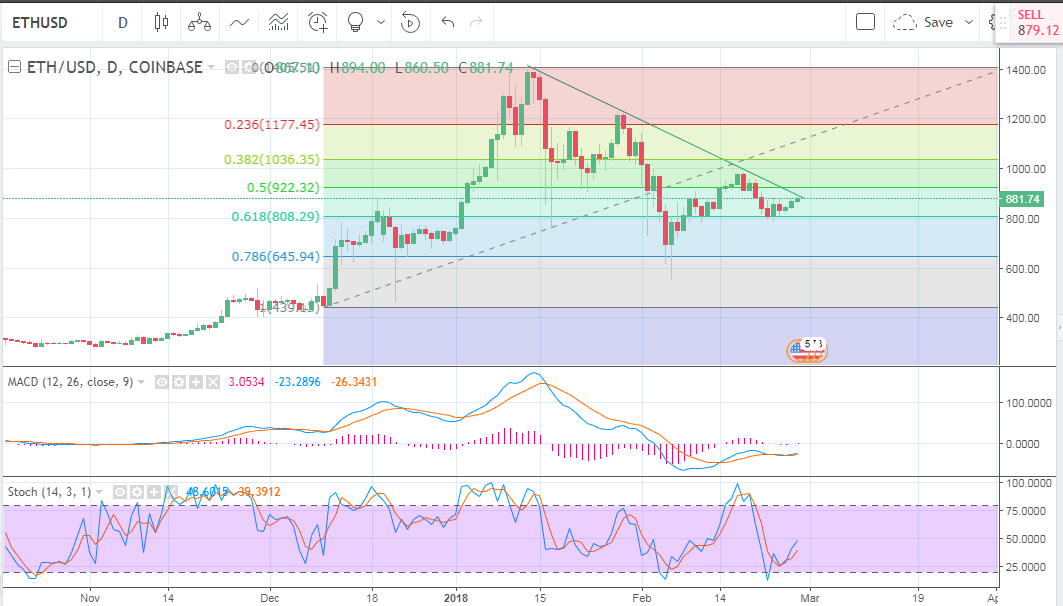
The downward slope line is acting as an immediate resistance for Ethereum and if it clears above then it will be a positive breakout and next target will be around $922-976 level where it is expected to be bit noisy.
Ethereum(Eth) has retraced from the 61.8 percent in Fibonacci scale on the daily chart in last three days.
Alternatively, if it fails to clear the resistance line then we can witness a pullback and $800 level will offer an excellent support.
This post has received a 2.59% upvote from @aksdwi thanks to: @bitzoner.