Bitcoin technical analysis 19.7.18 and bigger picture
Hey guys
So a lot is posted on bitcoin and everyone is kind of expecting a pullback here which would be normal. I've posted this graph yesterday:
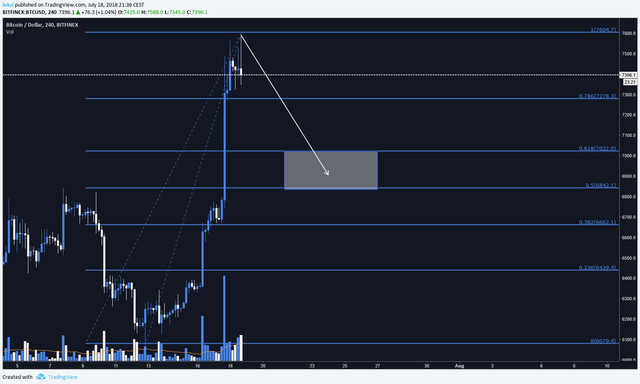
When breakout occurs it's common for a stock/equity/wtv to retest previous resistance as support, in this case 6850 which was the 1 month long resistance. It also represents the neckline of that inverse head and shoulders. So going down here is nothing bad just a normal price action.
Bitcoin did try to go there yesterday, but we might bounce of higher after all (see picture)
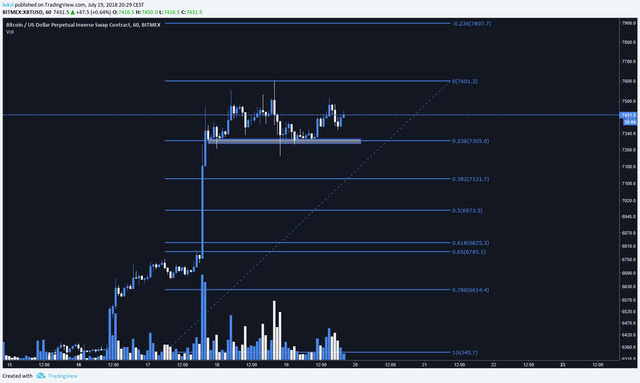
notice these little wicks rejecting downside. Indicators are now ready for a possible another run up. Right now we're consolidating still.
I want to touch the bigger picture here, let's look at weekly bitcoin: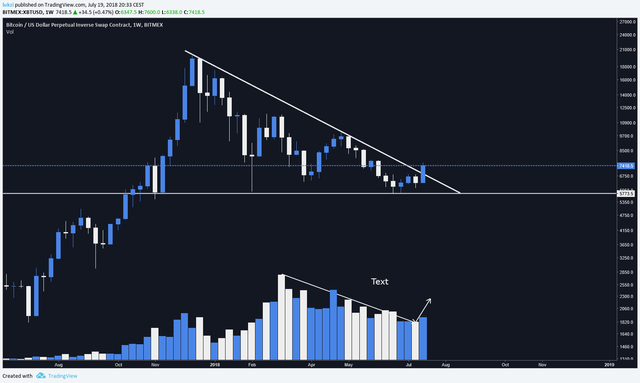
notice that candle penetrating the line? well if weekly closes above 6900 i'll consider this a very bullish sign. Another thing to point out is volume. Notice the volume bar below? It had more volume than previous weeks and it's not even over yet. This is also a positive sign.
With the ETF hype in august and many good news circling bitcoin (mastercard, institutions,..) this may very well be a start of a new bull cycle. I however will not trade until weekly close when the picture is more clear as to which direction bitcoin will go.
Best of luck!