BTC TA (Technical Analysis) - ANALYSTS DAILY SUMMARY - JUNE, 11th

NOTE ABOUT BLOG
The blog is still in it's infancy and I ask that you guys give me feedback on analysts being reviewed, layout etc. I've removed "The Moon" and "Coin Mastery" as analysts. In my experience (following both of them for quite a while now), they're more geared towards macro trends in the BTC Market, which is not the main focus of the blog. We try and do the heavy lifting for you guys, to give you a concise systematic DAILY TA ANLAYSIS of the BTC market. You can find "The Moon" and "Coin Mastery" on Youtube, for those still interested in following them.
JD Marshall
Type of Trader: Medium/Long Term Trader
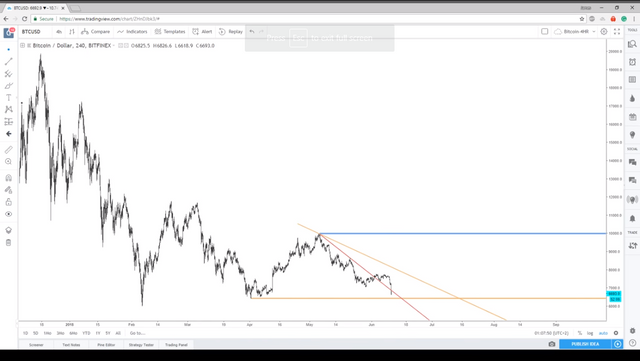
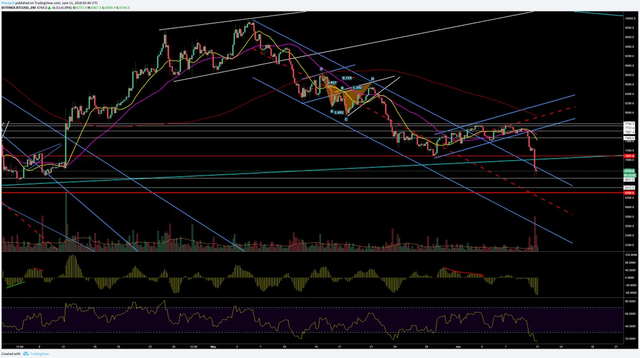
[Macro argument is that BTC is consolodating at these levels and building steam for higher highs in the FUTURE is still his macro perspective. In his opinion we're not seeing BTC reaching all time high any time soon. BTC next big resistance is the top of $9990. Since Feb. BTC's seen 3 major bottoms around the 6k-7k level. Which is an indication of forming higher lows and confirms a macro bullish trend (Green Line on Chart). Patience will be the key word for medium/long term investors in the BTC Market]
Support around $7k broke, which means that the next support will be tested around $6400, if that support does not hold we'll see BTC go even lower to around $6k. $6k is very weak support though. The macro uptrend line (on chart pink line) has been broken, which is a major bear flag for the market as a whole. Massive flash crashes is very bad for the moral of the small traders. Expect sentiment to worsen in the coming days.
Possible pattern forming in chart: Inverse cup & handle
Marshall does not like trading patterns (he's not a patter trader), but takes note of it non the less - a inverse cup & handle can be identified, that might be another omen for further lower prices.
(author's note - Marshall is a undiscovered jewel in the rough. He's level headed and gives good objective TA and fundamental analysis. He's got the makings of Peter Brandt jrn. - no nonsense analytic type. In the time I've been following him, his TA has been on the money.)
@chartguys
Type of Trader: Short Term Trader
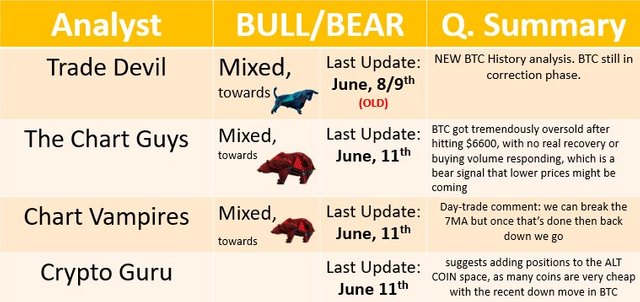
BTC got tremendously oversold after hitting $6600, with no real recovery or buying volume responding, which is a bear signal that lower prices might be coming. Key supports have been taken out, meaning that lower supports will be tested. Furthermore, more money will be leaving the space as prices go lower.
@tradedevil (NO NEW UPDATE)
Type of Trader: Short Term Trader/ Day Trader / E.W. Analyst
Looking at BTC's history and the correction pattern it's in, it's clear that BTC is far from finishing it's correction. The video is very informative, and help to give you the macro context of Bitcoin. The video ends with the following, which is quite a shocker for most bulls out there: "...so whether your a bull or bear, it doesn't matter what side your on, you have to acknowledge that the correction is far from over. When Moon? Not soon..."
chris L $ChartVampire$
Type of Trader: Short Term Trader/ Day Trader
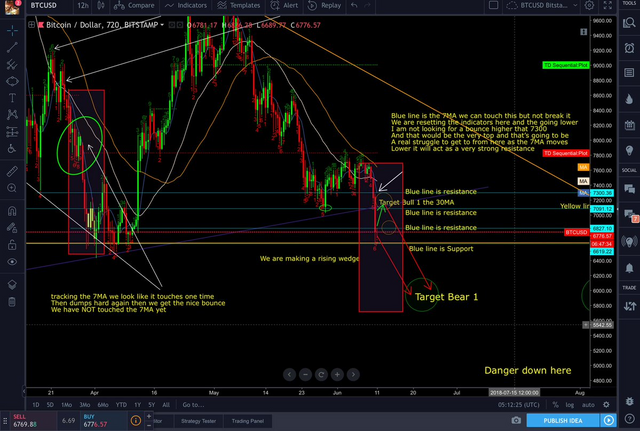
Christ just posted a new chart. Have a look at the chart for context for the following comments:
1-the 7MA is our target now to find our halfway or greater point of the drop we need to touch it once and it’s at 7300 now and dropping fast
2-we can break the 7MA but once that’s done then back down we go
3- continued
Peter Brandt **
Type of Trader: Short/Medium Term Trader
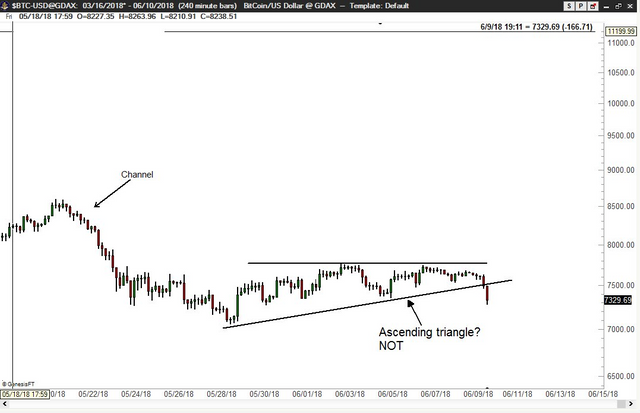
Peter Brandt made the following comment about the ascending triangle that's been broken.
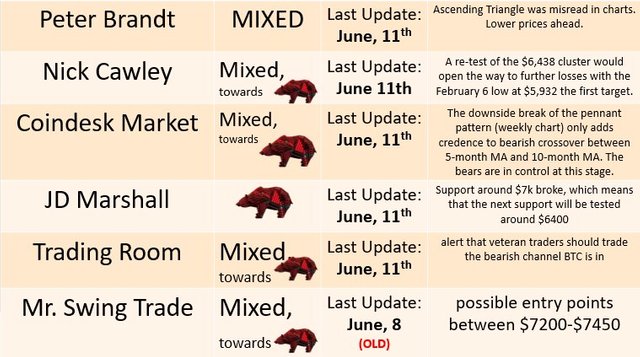
"So much for the ascending triangle that was misdiagnosed by a number of "chartists" on Twitter. It never met the criteria for an ascending triangle."
NOTE: Peter was expecting a big move in BTC either up or down, seems like he was right about the 'big move' happening.
Nick Cawley
Type of Trader: Long Term Trader/Investor
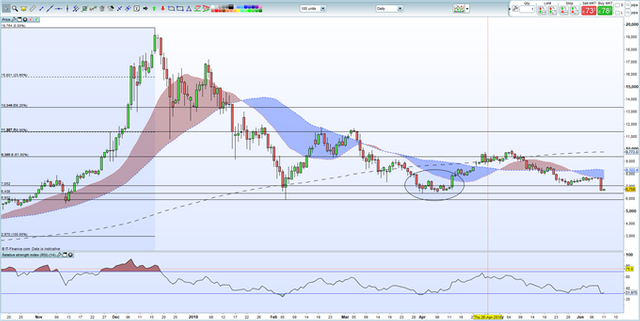
CRYPTOCURRENCY MARKET CRUMBLES – SUPPORT LEVELS TESTED
South Korean cryptocurrency exchange Coinrail revealed that it had been hacked on June 10 and that some of the exchanges cryptocurrency holdings had been stolen. Coinrail said in a statement that 70% of the cryptos it holds are safe, while two-thirds of the stolen tokens – NXPS, NPER and ATX – have been frozen or recovered. The news from this small exchange – Coinrail just makes it into the top 100 crypto-exchanges by volume traded – sent the marketplace spiraling lower with double-digit losses commonplace.
The move over the weekend may have been exacerbated by thin trading volumes but the fact that a small crypto-exchange hack produced such a large move shows how fragile the marketplace is.
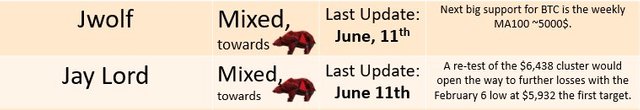
The weekend falls tested many important technical support levels with mixed results. Bitcoin (BTC) rebounded just ahead of a support cluster made in late April and looks likely to re-test the $7052 double-low made on May 28/29. A re-test of the $6,438 cluster would open the way to further losses with the February 6 low at $5,932 the first target.
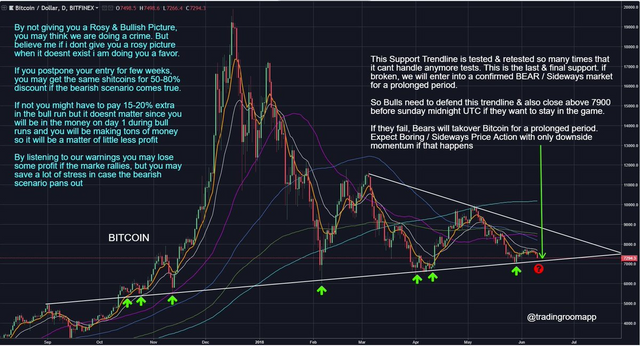
Trading Room
Type of Trader: Short Term Trader
Day -Trade alert: Trading room gave out an alert that veteran traders should trade the bearish channel BTC is in. He makes the following commment:
"This is high wire action. Don’t touch if you are a noob. Only for Pros, play this channel both way, more on the short side than long. Sell any bounce to 7050-7180 area"
previous chart just fulfilled (support broke and bears are in control)
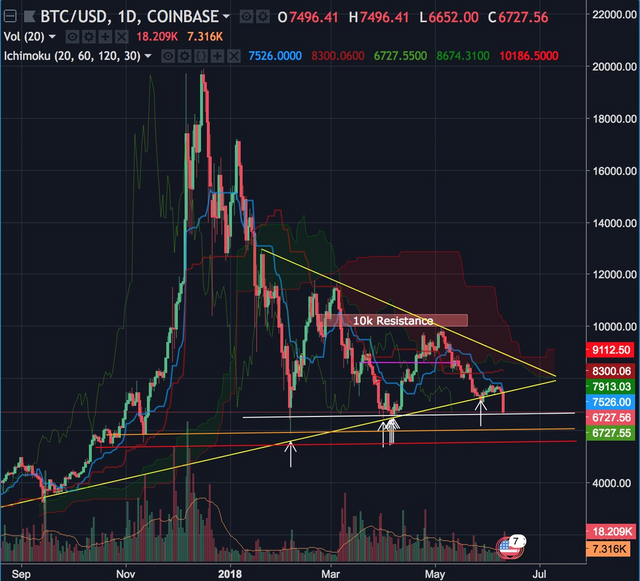
Crypto Guru **
Type of Trader: Short Term Trader
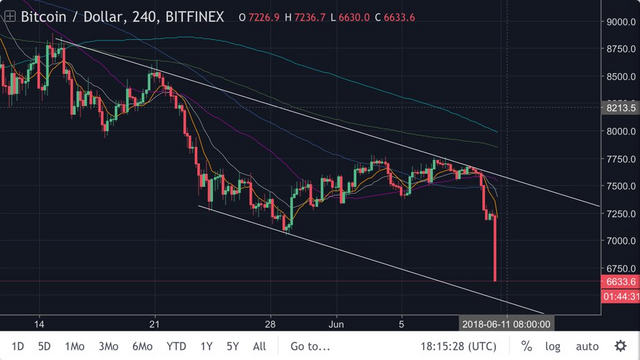
The lower support/trend line of the massive wedge broke as an immediate dump subsequently followed. He's surprised that BTC is back in the 6k range; He suggests adding possitions to the ALT COIN space, as many coins are very cheap with the recent down move in BTC. See chart for the next levels of support in BTC.
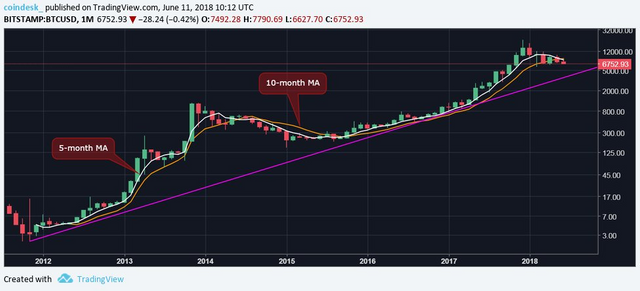
Coindesk Markets **
Type of Trader: Short Term Trader
The downside break of the pennant pattern (weekly chart) only adds credence to bearish crossover between 5-month MA and 10-month MA. The bears are in control at this stage.
Mr. Swing Trade (NO NEW UPDATE)
Type of Trader: Short Term Trader
1)If he is to remain bullish, these are the zones he would keep an eye out to go long for intraday trading between the swing-low and swing-high pivot points.
The highlighted ares in green is possible entry points between $7200-$7450 (on chart).
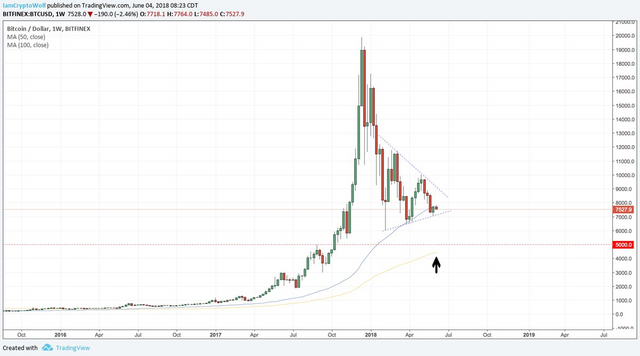
jwolf
Type of Trader: Short/Medium Term Trader
He makes the following 2 fairly positive comments in the light of the recent sell-off. 1) The 4h RSI is under 16% it happened only once and we reversed back in 2016. 2) Bullish div. on the weely if this price holds. If we manage to close daily above 7100, well, that would be a nice bullish reaction.
The next big support is the weekly MA100 ~5000$.
Lord Ray
On the largest spike in volume we have seen since April 12th, even more levels of support have been broken. $6,600, $6,400, and $6,040 are our last remaining supports before major moves down.
Also, a shout out to @famunger for his daily Analyst Summaries.
Go here https://steemit.com/@a-a-a to get your post resteemed to over 72,000 followers.