Part number three: First Results
Dear readers and followers, in this post i am going to present you the first results and how it was obtained.
So as you may remember from previous entries that i've posted, me and my colleagues performed term frequency analysis and sentiment analysis on 2 million 200 thousands tweets mentioning bitcoin over a period of 15 months starting January 2017.
Thus we obtained the graph with the spikes representing particular sentiment score for each day over investigated period, finally we were able to distinguish 7 major spikes that were clearly standing out from the general context.
Knowing these 7 dates, we knew where to dig deeper, thus we performed term frequency analysis for every day, knowing what people were mostly talking about on the days that had strong sentiment spikes allowed us to identify particular events.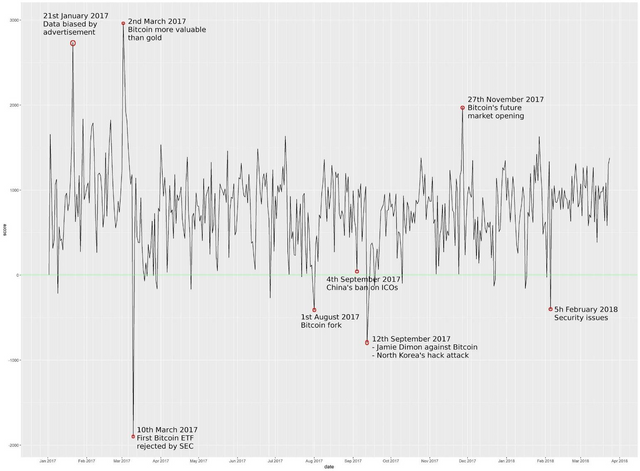
These are the events that we were able to distinguish, as most influential in 2017.
Over the next few posts, i will try to put these findings in perspective, and provide my readers with the insights about what kind of circumstances you have to seek for in the market in order to buy or sell bitcoin.
Thank you for reading.
Feedback is welcome and appreciated.
I can see how much effort you had to put in to examine so much data. The post is very well written and every post is enjoyable to read. Keep it up!
Thanks for support, appreciate it!
Very Nice way to explain.
Thanks for your feedback.