Bitcoin Checkup - Sideways Action - Larger Ascending Triangle Forming
Bitcoin has been moving along sideways since jumping up above the $10K mark. It has now been 16 days since that push and since then not a lot has happened as Bitcoin moves sideways occasionally dipping to test support around $11,400 and pushing upward to test $12,000 USD.
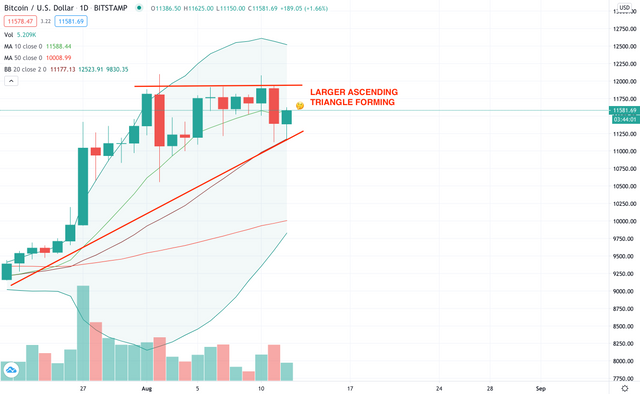
During sideways action like this, when it looks like nothing is happening, other things start to come into view. We saw an ascending triangle forming that Bitcoin broke out of yesterday. Now zooming out a bit it appears it's still in an ascending triangle, albeit a larger one!
What does this mean? Well, as long as chart signals are still bullish (which they are) we see this as a few more days of sideways action, possibly a dip for correction... and then a push upward (hopefully) out of this triangle and through the roof of the $12K mark!
Of course, anything could happen either way it's nice to see BTC showing it's volatile behavior again!
Keep watching the charts! 📈
Please note : this is opinion and should not be taken as financial advice.