Quick Charts December Bitcoin Price Predictions - Technical Report on The Bitcoin Bottom
Thanks for attending Coinsider's December Quick Charts Report with Michael Alexander! This report will focus on the bigger picture where we could be heading or Where Bitcoin Bottom could be and in what Conditions we need to see happen for the bottom to be in.
Quick Charts is about having an idea of where the next major price move could be so you don't miss out on the next big move in Bitcoin.
I'm creating today's presentation to bring you 3 Top Analysts views on where the Bitcoin Bottom could be.
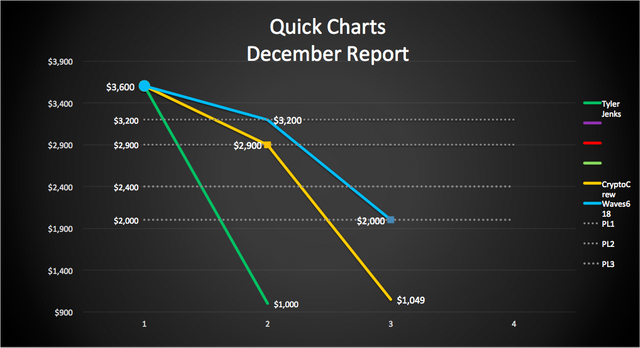
BELOW IS THE QUICK CHART FOR POSSIBLE BITCOIN BOTTOM FOR 2018 & 2019
BELOW IS THE YOUTUBE VIDEO FOR THIS QUICK CHARTS REPORT
==============================================================
WAVES618 PREDICTIONS
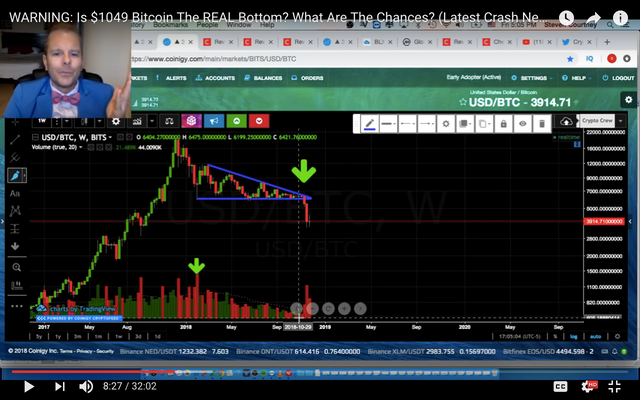
THE FIRST MAJOR STOP FOR BITCOIN = $3,200
THE SECOND MAJOR STOP FOR BITCOIN = $2,4070-$1,924
==============================================================
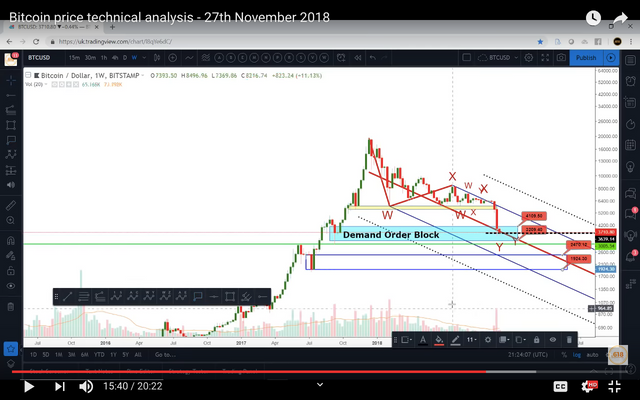
WAVES618 REASONINGS FOR $3,200
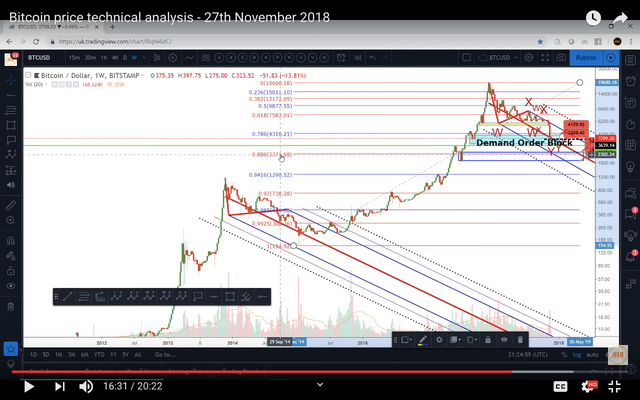
#1 DEMAND ORDER BLOCK (BLUE BAR)
The price could go down to the lower end of the demand order block (blue bar) at $3,200
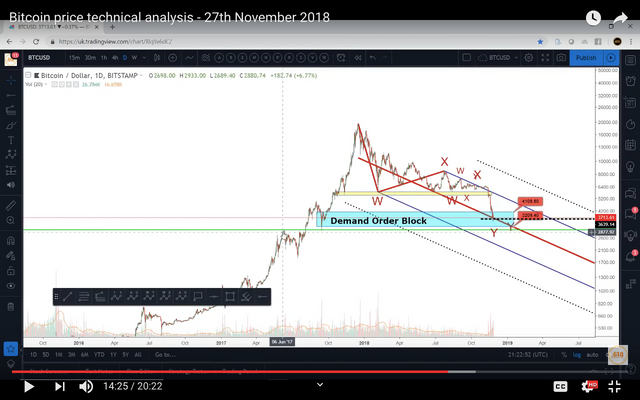
Youtube Author is Waves618
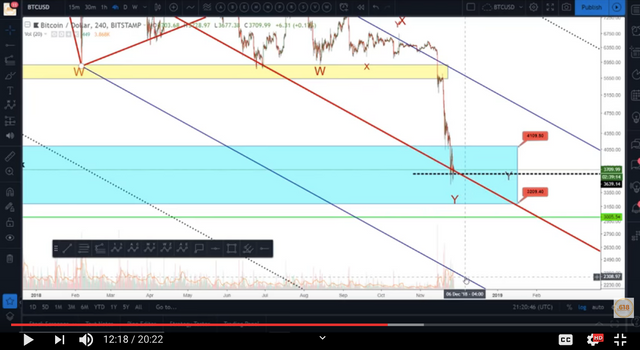
THE SECOND MAJOR STOP FOR BITCOIN = $2,4070-$1,924
WAVES618 REASONINGS FOR $2,470-$1,924
#1 THE SCHIFF PITCHFORK
If the median line of the Schiff pitchfork is broken (red line), then the next major target will be the lower median line at around $2,200.
Youtube Author Credits - Waves618
#2 DEMAND ORDER BLOCK (BLUE LINES)
The price could go down to the upper end of the order block at $2,470 and to the lower end of the order block at $1,924
Youtube Author Credits - Waves618
#3 FIBONACCI LEVELS OF .886 & .941
On the 1 Week Chart on Bitstamp, if we take the $154 bottom and chart to the $20,000 top, we reach a Fibonacci level of .886 or $2,371 and .941 or $1,910
Youtube Author Credits - Waves618
#4 CANDLESTICK ACTION & MEDIA REGARDING WHEN BITCOIN BOTTOM
WAVES618 also on "When is Bottom?" toward the end of the video and to summarize he mentioned that in order to have a traditional bottom we need to see a Big Hammer Candle (a lot more buying action) on high volume or at least a Big Doji Candle. As far as the media, there is not enough media attention. At a bottom or a top there is normally lots of hysteria from the media. The news of bitcoins blood bath would be trending very high. In conclusion, until we see this scenario of candlestick action and media hysteria the bottom is not in.
==============================================================
CRYPTO CREW UNIVERSITY PREDICTIONS
THE FIRST MAJOR STOP FOR BITCOIN = $2,950
THE SECOND MAJOR STOP FOR BITCOIN = $1,150
==============================================================
CRYPTO CREW REASONINGS FOR $2,950
#1 Major Previous Support/Resistance Combined with a Major Move
There was 70 days of resistance at the $2,950 level before breaking through. Once we broke through we held support and continued on a massive bull run up to $20,000.
Supporting/Corroborating Evidence
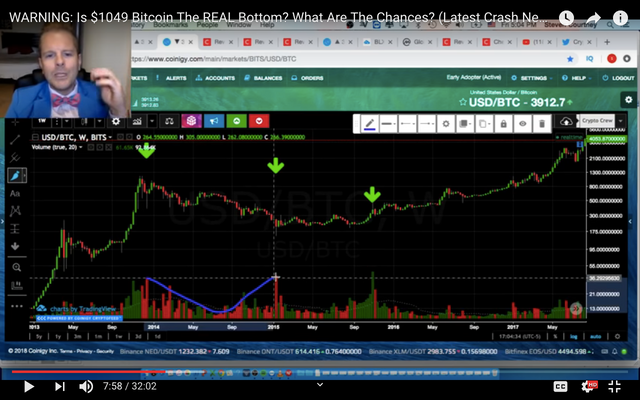
(1) Back in 2014 we had a 3 Day Death Cross and Crashed 54% (from about $310 to $154). If we repeat history from 2014 then in 2018 another 54% Crash (from about $6100 to $2950) would bring us to around $2950.
(2) We have the 200 Weekly Moving Average which the Bitcoin weekly candle has never gone below in 8 years. It has touch it twice, the first time being the capitulation candle, and the second time with a candle that marked the end of the bear market. Currently the 200 MA Weekly is at about $3,100. If we had a wick to pierce through the 200 MA Weekly and then hold support on the 200 MA Weekly then things may look good from a technical standpoint. To confirm this is a potential bottom we need to look at 3 things:
[1] Volume - The Capitulation Candle should be higher than the Feb 6th 2018 Candle on the Weekly Chart.
[2] Price Action - We need to hold above $2,900
[3] Support - We need to hold support on the 200 Moving Average on the Weekly Chart.
Youtube Author Credits - Crypto Crew University
CRYPTO CREW REASONINGS FOR $1,150
#2 Major Previous Support/Resistance Combined with a Major Move
If $2,950 does not hold, then the next major previous support/resistance zone which had a major move up was the $1,150 area. The held as resistance for over three years and when it broke we had a major move upward from $1,000 to $20,000.
Youtube Author Credits - Crypto Crew University
CRYPTO CREW SUPPORTING REASONINGS FOR THE BITCOIN BOTTOM
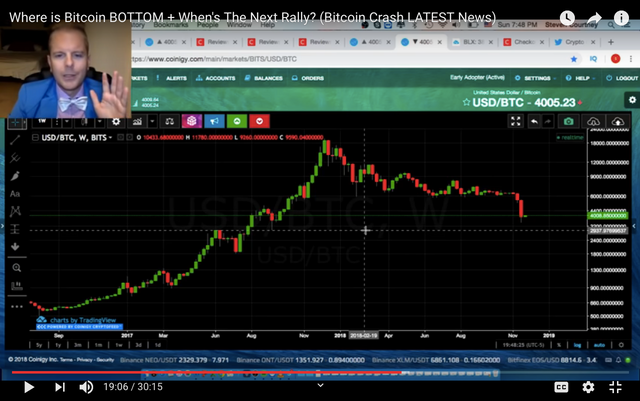
#1 BOTTOM CONFIRMATION - U VOLUME SHAPE & HIGH VOLUME
We need at U in Volume which can signify the Bottom. So far we have reached the middle of the U.
The blue U curved line at the bottom signifies the distance between two capitulation candles. Crypto Crew mentions the smallest volume is right in the middle which we had a few weeks ago (see IMAGE 2). In Crypto Crews charts we see 2 U's. The first U ends with the capitulation candle. The second U ends with the 2014 bear market. So it seems that there are two periods when finishing a bear market. The first U will is the capitulation candle and the second U is the end of bear market candle. For 2018, the candle that ends the first U must be significantly higher than the the Feb 6 2018 candle.
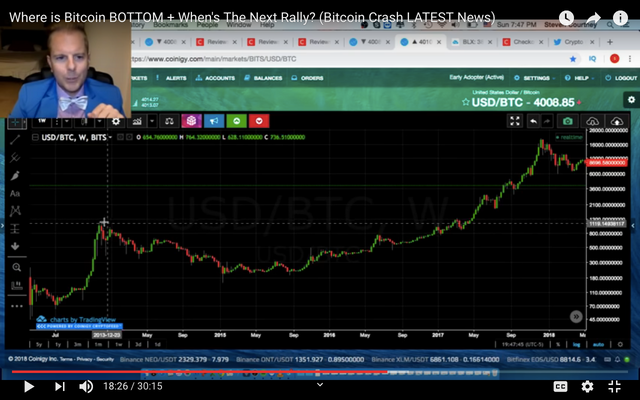
[IMAGE 1] Showing 2014 Market at how we completed a U shape and followed up with a second U volume profile.
Youtube Author Credits - Crypto Crew University
[IMAGE 2] Showing 2018 Market and how we are half way through the U profile.
Youtube Author Credits - Crypto Crew University
#2 BOTTOM CONFIRMATION - THERE IS A MAJOR MOVE UP ON CAPITULATION CANDLE
In 2014 we had our capitulation candle hit $155 and then quickly spike up close to $300, which then follows a consolidation period.
Youtube Author Credits - Crypto Crew University
==============================================================
HYPERWAVE PREDICTIONS
THE FIRST MAJOR STOP FOR BITCOIN = $2,800-$3,200 (Temporary Bottom)
THE SECOND MAJOR STOP FOR BITCOIN = $1,000 (Closer to the Bottom)
==============================================================
Who is Tyler Jenks and what is a Hyperwave?
Tyler Jenks is one of the creators of the Hyperwave Technical System created in 1979. A quote from one of his Medium articles in August 4th 2018 states that "On a psychological level, Hyperwave is a simple model to explain what happens when people refuse to allow the numbers to add up." On the technical level there are seven phases to a hyper-wave. The first four phases are bullish and the last three phases are bearish. According to Tyler, the $1,000 price point was phase 1 and the $6,000** price was the phase II area (mentioned from his Hyperwave channel on Youtube on Dec 3, 2018). While we were above $6,000** we had a 1 in 4 chance of staying above that level, but now that we have broken the Phase II, we should eventually go back down to Phase I at the $1,000 price point.
HYPERWAVE reasoning for Bitcoin at $2,800-$3,200
Tyler believes we may have a resting spot temporarily here. He does not give specific reasons why in his Dec 3rd Youtube Video or Twitter account.
HYPERWAVE reasoning for Bitcoin at $1,000
When we break a Phase II level, which is Bitcoin's $6,000 then we should go down to the Phase I level at $1,000.
**There is a discrepancy on the Phase II Hyperwave of Bitcoin from the Aug 4 2018 Medium article and the Dec 3 2018 Youtube Video. The Medium Article mentions that $3,000 is the Phase II level and the Youtube video mentions that $6,000 is the Phase II. This article is references the Dec 3 2018 Youtube video of $6,000 being the Phase II level.
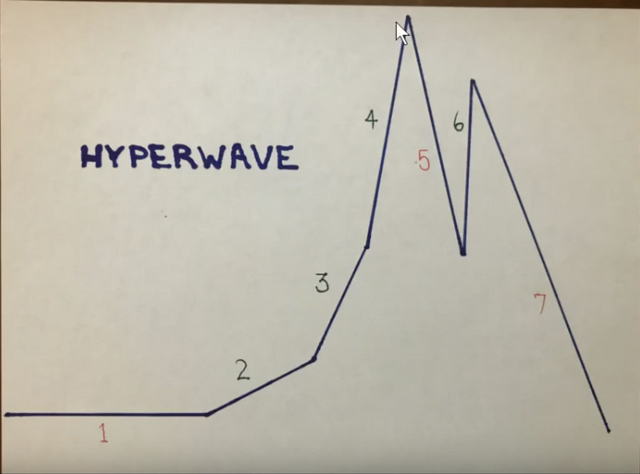
Youtube Author credits - Hyperwave
==============================================================
COINSIDER CONSIDERATIONS
==============================================================
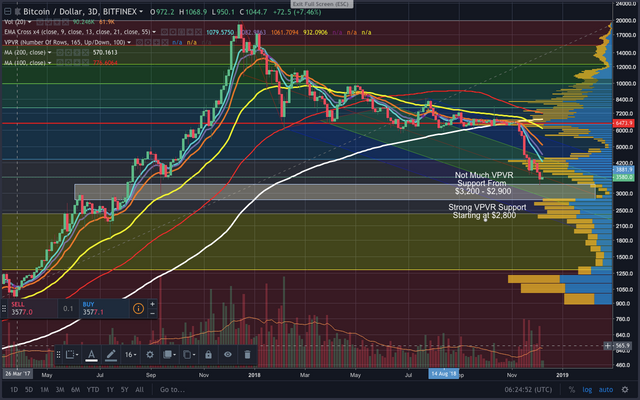
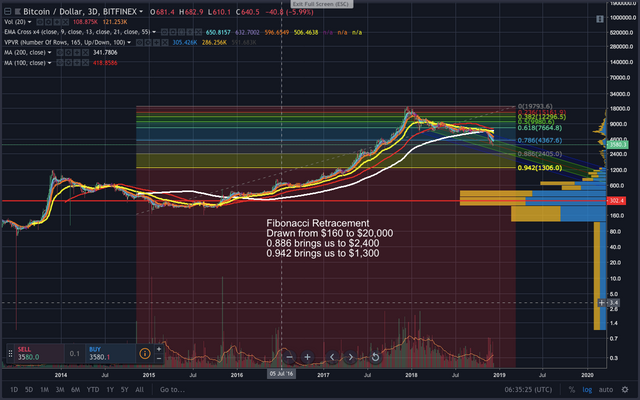
1. MAJOR VPVR NODE SUPPORT AT $2,900
Even though price has dropped down to $3,250 we still see there was not much volume support in this area. This is a gap all the way down where there is more volume at $2,900 and a much better VPVR support would be at $2,800-$2,700.
2. Key Fibonacci Levels from 2014
0.886 from the 2014 low of $170 to $20,000 brings us to $2,400 (Previous Support/Resistance up to 6 weeks)
0.942 from the 2014 low of $170 to $20,000 brings u to $1,300 (Previous Significant Support/Resistance over 3 years )
==============================================================
COINSIDER COMMENTS
==============================================================
I. As far as our current state of Bitcoin, Waves618 we have already reached the lower end of the first Order Block at $3,200, therefore we may be seeing a bounce from this area.
II. As far as if the Bottom is in from a Technical Standpoint, Waves618 and Crypto Crew both mention we need to see a conclusion with lots of volume coming in. Waves618 mentions a big hammer or at least a doji candle. Crypto Crew mentions we need the capitulation candle to be higher than the Feb 6 2018 candle and we need to complete a U shape volume profile as well as seeing a significant bounce at least 50%. In 2014 we saw a 100% bounce from the $170 level up to the $300 level.
III. As far as if the Bottom for Bitcoin is in from a Psychological Standpoint, Waves618 mentions we need lots of Media attention mentions the bad state of Bitcoin and crypto. We have not had this type of attention yet at the $3,250 level.
IV. As far as what key levels we may anticipate to see a "Bottoming" situation, we will be looking for:
(1) $2,700-$3,000 zone
$3,000 is a major psychological number which may acts as support
$2,950 is about the same 54% drop we had in price from the 2014 drop
$2,700 has lots of VPVR (volume) support)
(2) $2,400-$2,000 zone
$2,400 is the .886 fibonacci from $165-$20,000
$2,000 is the lower end of the order block according to Waves618
(3) $1,300-$1,000 zone
$1,300 is the .942 fibonacci from $165-$20,000
$1,000 is a key psychological level, has much more VPVR (volume) support and is considered a Phase I "Hyperwave" area we should reach according to Tyler Jenks of Hyperwave since we broke the Phase II level of $6,000.
V. As far as timelines
Traditional markets normally see a capitulation candle, followed by a consolidation period and then a second significant candle showing we are ready to make our move to the next bull market. If we do see our high volume capitulation candle then we can expect several months of consolidation. I am not mentioning specific amount of months in this comments, only that we normally see a consolidation period.
VI. As far as could the bottom already be in at the $3,200 level?
Technically any thing is possible and yes it could be a technical bottom. But if we look at how Bitcoin behaved in its previous bear market of 2014 and we also look at the traditional markets, the behavior is similar. The chances that we do know see the most common features of typical bear markets and we are already at the bottom could be possible but the chances are low.
COINSIDER DISCLAIMER
Coinsider's considerations of other analysts and comments are not intended as financial advice, only for educational and entertainment purposes.
Thanks for the report.
No problem. I'll be coming out with a video on my youtube channel so when ready i'll update a link here.
Resteemed, as an eternal optimist I am sticking with $3200 as the bottom. If I am wrong so be it.
If your sticking with the Bitcoin fundamentals long term then your on the right path anyways!!
Well I would say I would trust this calculation:
Fibonacci level of .886 or $2,371 and .941 or $1,910
My thoughts are that the goal of the movers/shakers is to shake out the weak hands. I'm starting to think that sub 2k may do that. First let's see what happens at the $3,000 zone.
Congratulations @coinsider! You received a personal award!
Click here to view your Board
Congratulations @coinsider! You received a personal award!
You can view your badges on your Steem Board and compare to others on the Steem Ranking
Vote for @Steemitboard as a witness to get one more award and increased upvotes!