You are viewing a single comment's thread from:
RE: BitShares (BTS) is Following the Prescribed a,b,c,d,e Pathway Pretty Well!!
Yeah I agree, it's looking more and more likely now.
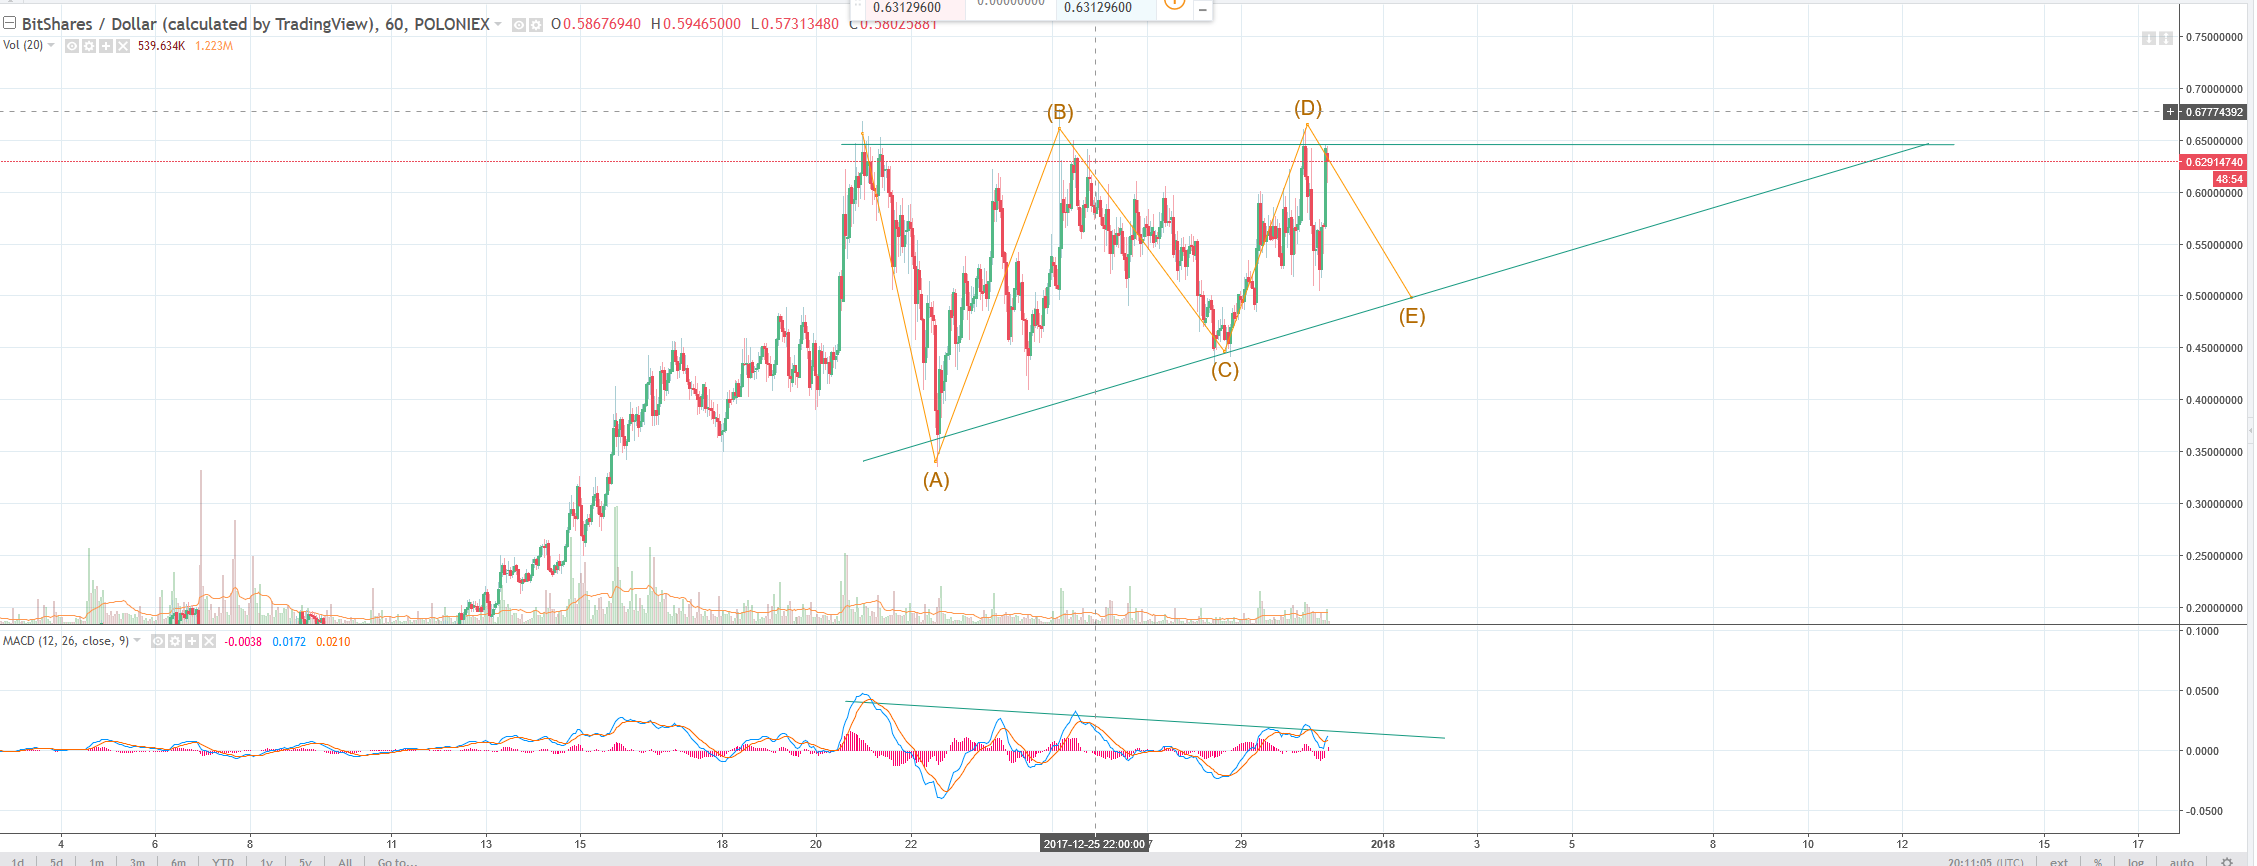
I kept my original count and added @haejin's for reference.
It had momentum but couldn't break out, so I think it will retest the lower end for support
As of now, this is not correct anymore. I believe it is ascending triangle we are seeing. Once E is complete, I will be casting buy ladders.
Happy holidays.
Just an update.
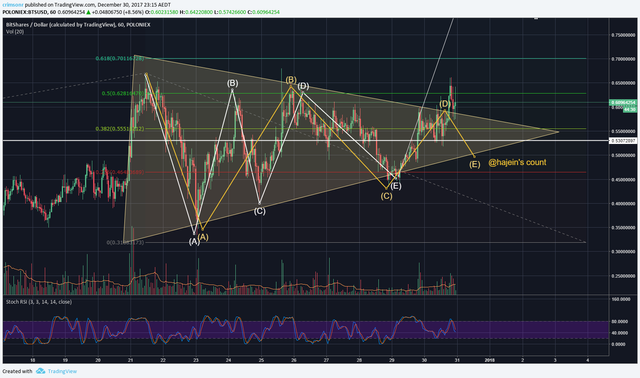
I'll re-chart as an ascending triangle/wedge, but that isn't exactly bullish....
My view on things:
Ah apologies, I thought you meant rising wedge. Nice one.
If this happens, we will see a bull run. After that, however, we might see a correction, since the 1 day MACD is truly overbought
It looks probable. How ever i am leaning towards @haejins's alternate count on BTS/BTC head & shoulders. Then how would this effect BTS/dollar?
I don't often chart BTC pairs because it can mean a few different things:
I believe most people still, even if it's just at a conceptual level, translate BTC value back to USD anyway.
So, if BTCBTS completes the H&S it could still mean a higher BTSUSD value -- it just depends how high BTC goes vs USD, and how low the BTCBTS ratio goes. This is why I stick to USD charts as it becomes messy.
Yeah your right it gets messy. I have been having a day of fear and sold all my long term holdings at the low. and been buying and selling other coins constantly for no reason. making unnecessary loss's. funny how fear just takes a grip. I have to take a brake.
Exactly my thoughts. For me it is an indicator on how well the alt-coin is doing compared to bitcoin. One could even argue that the best performing ones could be the ones to threaten bitcoin, as I believe there will be dethroning of the king.