A lilttle recover on the price of Bitcoin after fud, but...

The bearish projection presented in the market in general caused that many people will end up selling their digital assets for fear of suffering considerable losses in their portfolios, apparently the calm is about to present itself in the next hours or better called a pullback in the price of cryptocurrency in general does not mean that it is a purchase opportunity in cryptocurrencies in general for the long term, perhaps not yet the right time to buy (yet) after the fear generated. Analyzing the price of bitcoin in extremely small temporalities, it is possible that there is an increase in its price for a short period, below I attach a temporality graph of 15 minutes in the pair BTC / USD.
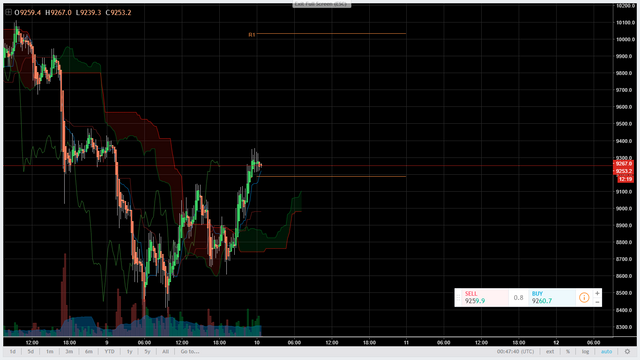
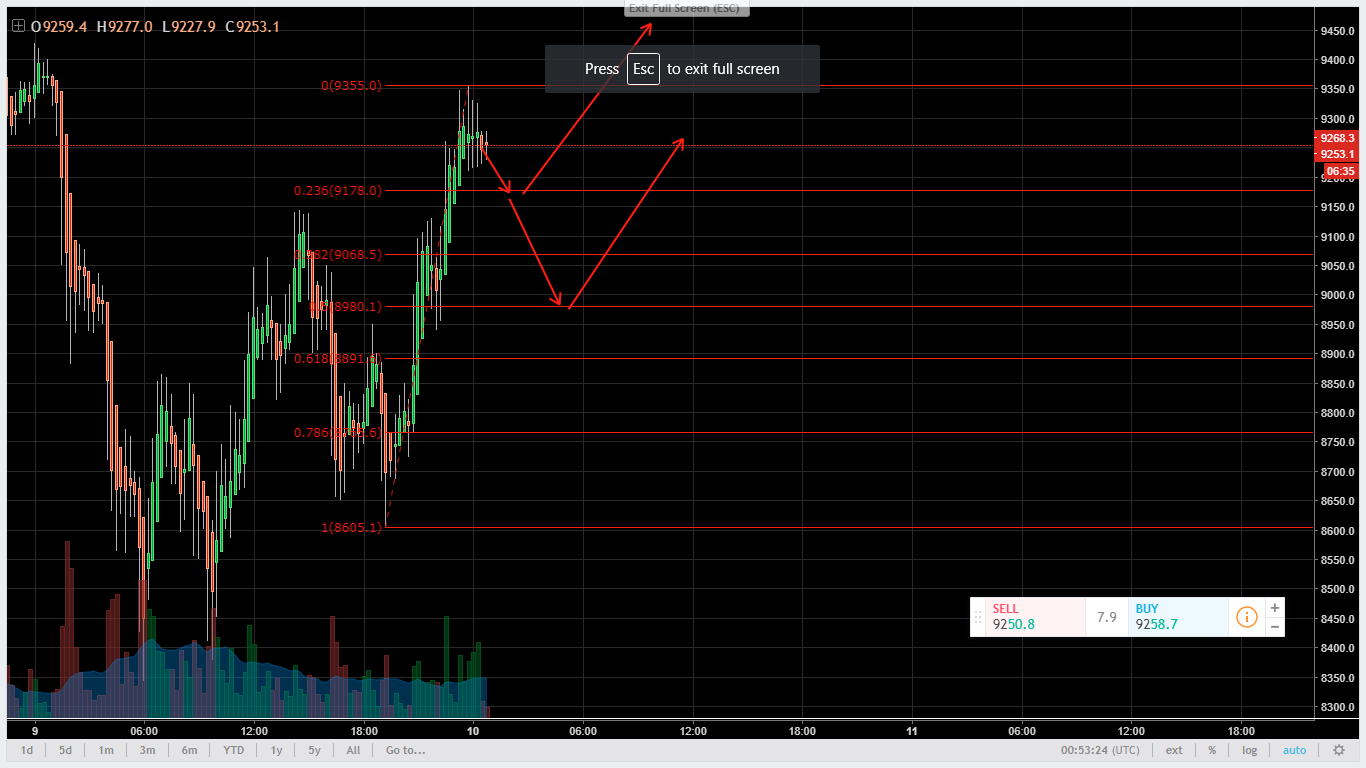
It can be seen that the price made a slight increase, but if it continues to incriminate considerably is very likely to fall again if the volume does not accompany it, the possible rise that occurs in the following hours also present a small correction, presenting so some possible buying opportunities for the scalpers traders, in the following image I show with arrows the possible movements that bitcoin will perform in the following hours.
It is not a purchase recommendation for Bitcoin, you have to have a lot of patience since personally, it may be that the price of Bitcoin may take a few more months to recover, that is, if there are no new bad news that may affect the price. , whether they are regulators, other malicious bots, hacks, etc.
Now, if we see a graph in time frame of 4 H it is coincident that it is very likely that a correction is presented upwards but not for a long time, I share my projection of the price of Bitcoin in the following chart of 4 hours.
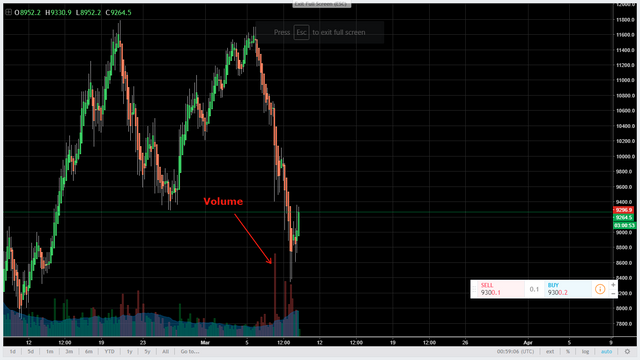
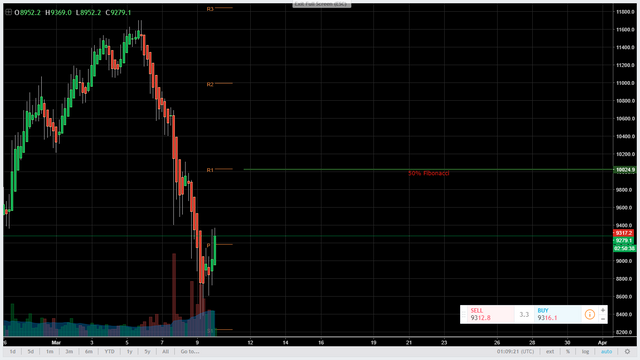
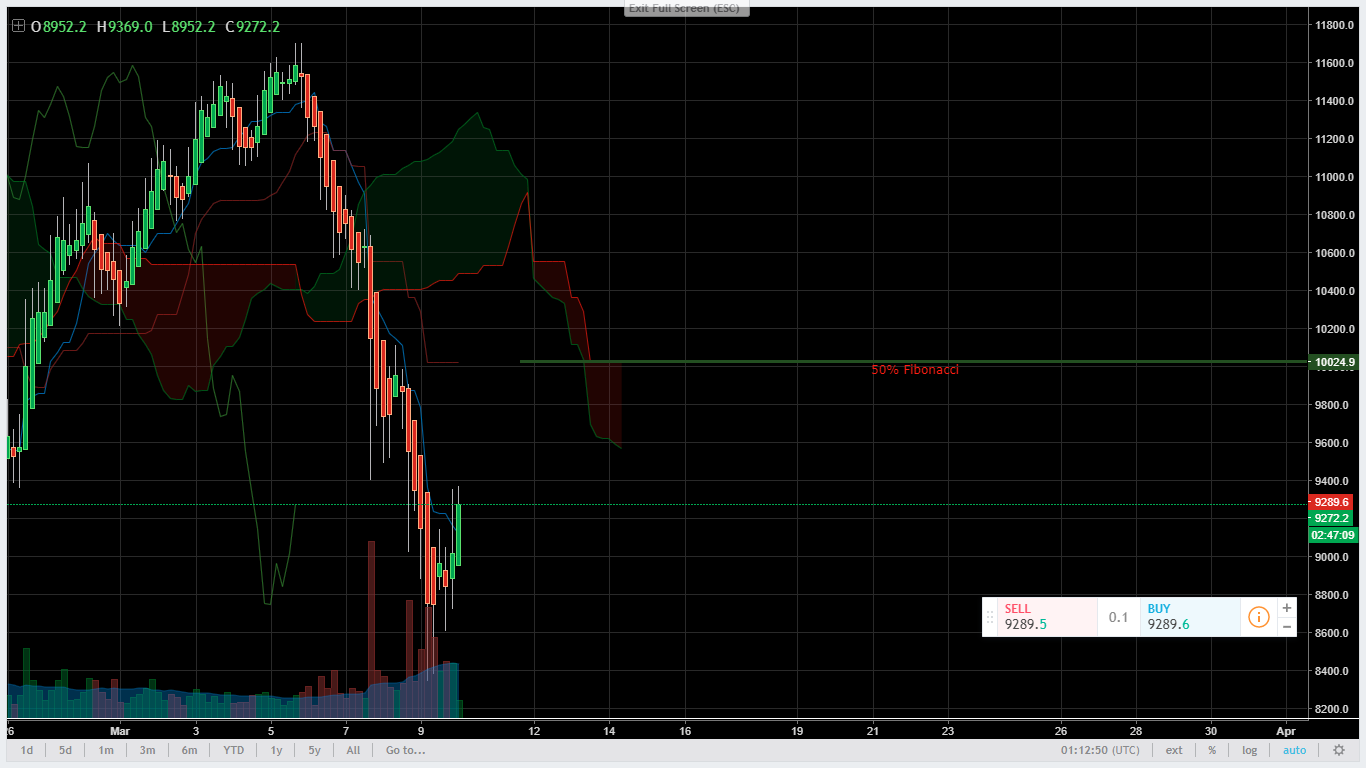
First of all observe carefully the volume presented that accompanies the dowtrend projection, this is important, because if the volume of sale is much greater than the purchase is very likely that in a couple days it will again present a projection towards the low beating the lower level above. It is very possible that the possible increase presented below is not accompanied by purchase volume, so its possible recovery is approximately $ 10,000 USD since that level represents 50% of the fibonacci retracement and hence, in case If the price reaches that level, it is very likely to fall again.

This, we can also corroborate if we add another technical indicator that are the pivot points, which in turn the daily pivot point shows a resistance at that same level of 50% of the retracement.
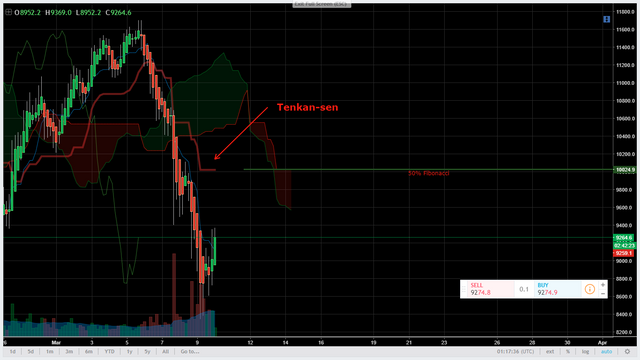
Now let's also add another technical indicator that I usually use to identify the trend, the ichimoku cloud, in one of my previous posts I explained the use of this indicator, which is very simple and is to identify the trend, if the price is found below the cloud, it means that the price is in a bearish trend, as I show you the following image below.
Another thing to note about this technical indicator are its "moving averages", of which, when crossed, they present signs of purchase or sale according to these lines, which are called Tenkan-sen (red line) and Kijun. -sen, of which these lines represent supports or resistances according to the tendency. Also, as can be seen, the Tenkan-sen coincides with both the daily pivot point and the 50% retracement of fibonacci.
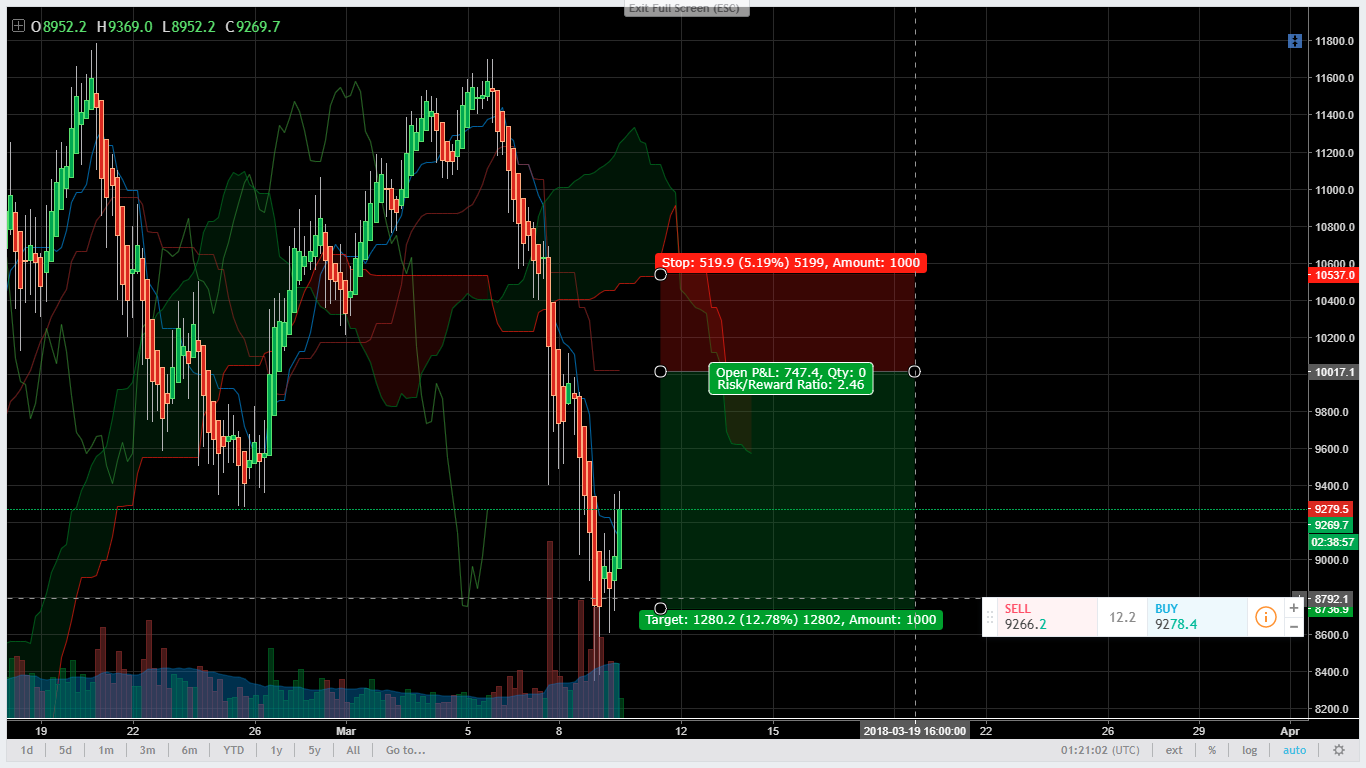
In conclusion, there is a probability that the price will recover but rather it would be an opportunity to enter short at the mentioned level of 50% of the fibonacci retracement.
Disclaimer: Before entering make decisions on buying or selling it is advisable to perform your own analysis. You can get short in ethereum on Bitfinex exchange using margin trading.
@resteemator is a new bot casting votes for its followers. Follow @resteemator and vote this comment to increase your chance to be voted in the future!
Your name sounds like "el mameytor pata's" XD