Bitcoin 2013 crash vs 2018 crash. Side by side.
The Bitcoin crash of 2013 could be summed up by one major event. MTGOX.
The Bitcoin crash of 2018 is more than likely a string of terrible events that took the wind out of our sails. Oh and also MTGOX.
Lets compare side by side 2013 crash vs 2018 crash.
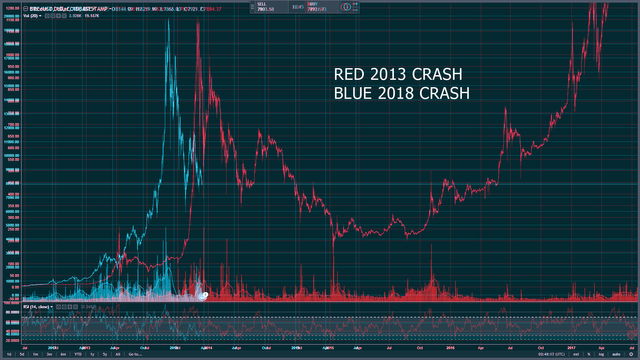
I misaligned the images on purpose so you can see each of them and how similar they are.
Here they are lined up:
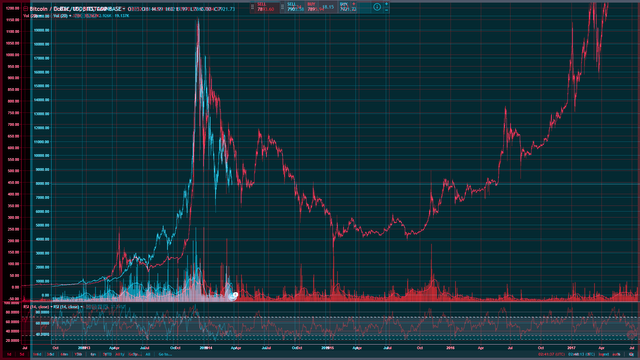
Both charts show volume just dry up over a few weeks.
The 2013 crash was down 86% when it was all said and done. Taking BTC down to $168.
2018 crash has taken BTC down to 70% at $5800.
This is an interesting shot.
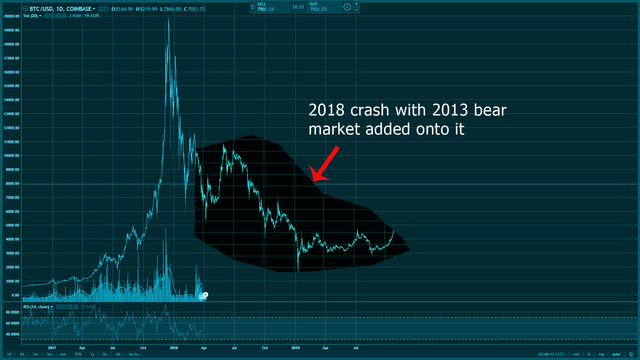
I added the bear market from 2013 where it lines up and we can see if history was to repeat itself BTC it would head down to less than $2,000 again.
If the crash pattern were to follow 2013 we would see Bitcoin retrace 86% down to $1900.
Oh how I miss the days of riding the skies with Bitcoin
My opinion: We wont see 3K BTC for very long...if it ever happens again. Put your orders in because it will only be there for a few minutes.
Disclaimer: This is not financial advice. This is only my opinion. Do not invest more in the markets than you are willing to lose.
What do you think? Got any coins you want me to look into?
Great analysis. Thanks for the in-depth comparison.
For future viewers: price of bitcoin at the moment of posting is 7820.90USD
Hey @crits, great info on Bitcoin! Thanks for sharing. The markets are fun right now and it's great to have the updates from good content here on Steemit. Cheers!
Congratulations @crits! You have completed some achievement on Steemit and have been rewarded with new badge(s) :
Click on any badge to view your own Board of Honor on SteemitBoard.
For more information about SteemitBoard, click here
If you no longer want to receive notifications, reply to this comment with the word
STOPVery similar...The liquidity of BTC is much greater today and appears to truncate the time, IMHO.
I think we are equal to July on the 2013 chart, you can see the same type valley with the double tops that follow. If that is correct we should be shooting up after one more low.
I'll give you artistic license on the pasted 2013/2018 chart, but you have the valley and double tops I mention above consecutively. I don't think it will drag that long or low. Lmk what you think.
Let it go to 1 dollar still I am not going to part away from my investment in BTC. HODLER I am and I am sure gonna hold it for a long long time.
nice post