Bitcoin, Ethereum, Ripple, NEO Make New Highs, EOS at Some Loss: Price Analysis, June 7
BTC/USD and the others establish new highs meaning the correction is still on. EOS loses a little

Cryptocurrencies from the top 20 continue to establish new highs except EOS, which was unable to grow in the past 24 hours. This means that technical correction continues without any fundamental basis.
What are the reasons for this correction? First of all, traders and investors learn more about charts and how to read them. They have seen the support areas for different cryptos and started to buy them increasing positive volumes.
The second reason is that the others have seen BTC and its rivals to grow in the past several days and they also place long orders hoping to purchase cryptos at their lows as they think the whole industry is oversold in the moment of writing.
As for the interesting news, there is almost nothing to pay attention to except Vitalik Buterin’s statements on Blockchain technology. Famous Canadian programmer and Ethereum’s CEO has mentioned that Blockchain is unsuitable for governmental voting.
Bitcoin (BTC/USD) Price Analysis, June 7
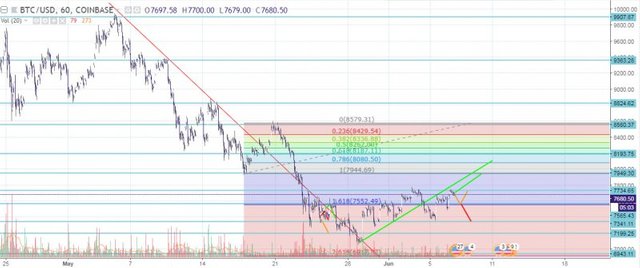
Bitcoin has added more than one percent in the past 24 hours meaning the currency pair still continues its upside correction. However, BTC/USD was unable to breach the green ascending trend line from below.
Let’s have a closer look at what is going on the hourly chart. The flag pattern failed to develop as BTC price went through the support area at $7,565 on Wednesday. However, BTC/USD returned above this level later and continued to grow. Bitcoin has reached the next resistance area at $7,734 on Wednesday. What are the possible way for Bitcoin?
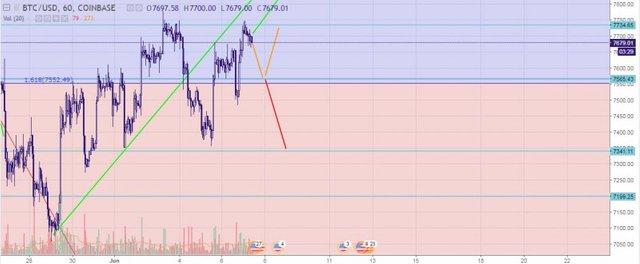
Red scenario (bearish). The currency pair will move towards the closest support area at $7,565 and break it through targeting the next support area at $7,341.
Orange scenario (neutral). Bitcoin will stay within the range limited by the support are at $7,565 and the closest resistance area at $7,734.
Green scenario (bullish). BTC/USD will test the closest resistance area at $7,734 and break through this level targeting the next resistance area at 7,949.
Ethereum (ETH/USD) Price Analysis, June 7
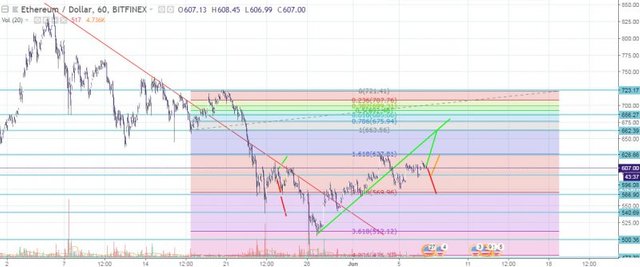
Ethereum has added more than one percent in the past 24 hours and established new local highs. However, the currency pair is still in correction. It is too early to say that we have a reverse of a midterm downside tendency.
Let’s see closer what is going on the hourly chart. Ethereum formed a Flag pattern yesterday but declined later, breaking this formation. However, ETH/USD has managed to move higher again as it has found support at $596.08. There is another bullish flag currently on the hourly chart. ETH price is below the green ascending trend line. The possible ways for Ethereum are the following:
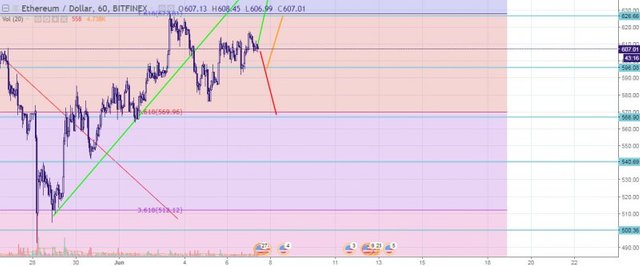
Red scenario (bearish). ETH/USD will move towards the closest support area at $596.08 and break through it targeting the next support area at $566.90.
Orange scenario (neutral). Ethereum will stay within the current range, limited by the support area at $596.08 and the closest resistance area at $626.66 without significant price changes.
Green scenario (bullish). The currency pair will break through $626.66 targeting the next resistance area at $662.39, which coincides with the one retracement level.
Ripple (XRP/USD) Price Analysis, June 7
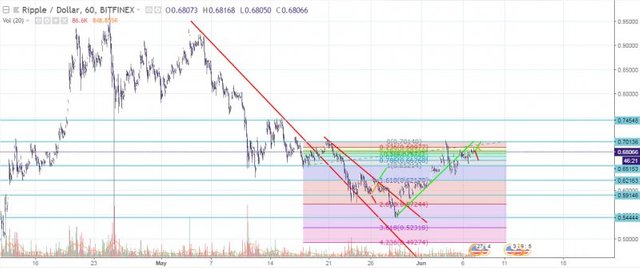
Ripple has added almost two percent in the past 24 hours as the currency continues its upside correction to the midterm downtrend. XRP/USD has established new local highs but we can’t say currently that the correction has ended and we have a clear upside tendency as Ripple still fluctuates within the Fibonacci retracement tool.
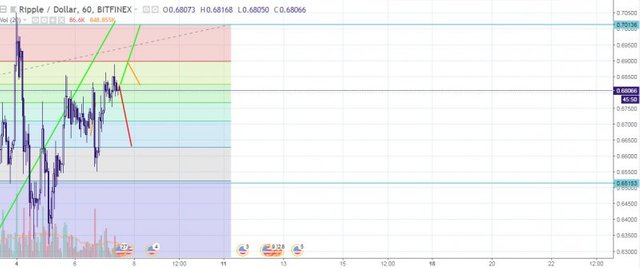
Let’s see closer what is going on within the Fibonacci retracement. The currency pair managed to test 0.786 retracement level, but was unable to break it out and reversed there. XRP/USD went upwards later on Thursday and reached 0.382 retracement level. It stays close to this position in the moment of writing. The possible ways for XRP/USD are the following:
Red scenario (bearish). Ripple will move downwards through several retracement levels targeting 0.786.
Orange scenario (neutral). XRP/USD will stay within the horizontal range, limited by 0.382 and 0.236 retracement levels without any significant price changes.
Green scenario (bullish). Ripple will grow targeting $0.7013 resistance area, which coincides with zero retracement level.
Take a look at EOS (EOS/USD) and NEO (NEO/USD) Price Analysis, June 7
Waiting for a daily close above $7,700 before taking anymore entries, a rejection from this level and the sell off continues maybe towards $5,000.
Coins mentioned in post: