Bitcoin and Cardano are on the triangle, Ethereum is still on the “Rising Wedge”
Bitcoin is on the big “Ascending Triangle”
Currently, it trades between the two blue lines. Above is the resistance at $6,767 where BTC has tried to break out several times, one attempt was successful but let's call this a fakeout. The second one is below the current price at $6,460 which works as a support. On Sept. 26th and 27th, it worked nicely as a support and it holds that price very nicely. Over the weekend, we touched it again and got a bounce, but this time, this level is much stronger than before because in this area we had the trendline and the golden Fibonacci level 62 percent crossing area which makes this price level much stronger to break through.
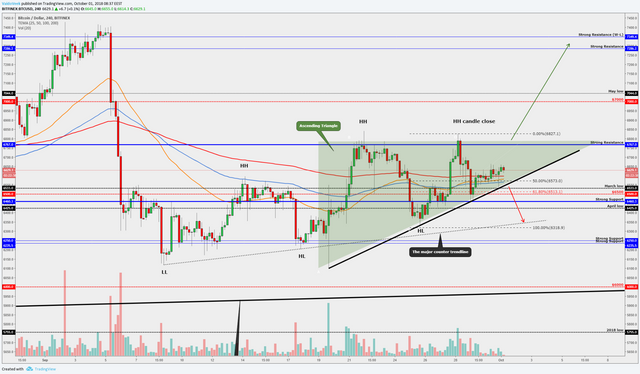
Over the weeks, the chart has drawn a bullish pattern called "Ascending Triangle" which will indicate that we might see a breakout upwards. However, we always have two breakout opportunities from the triangle, but this 'ascending' means that we have an edge to break upwards. Also, we have nice and clean higher highs and higher lows on the price structure which indicates a little bullishness.
Let's talk about a couple of scenarios:
In general, during the weekends there is very low volatility and we needed a lot of power to make a breakout upwards. We didn't catch that power and the price is still in the triangle. At the moment we trade above the important EMA's and on the four-hour chart we got a bullish "Hammer" candlestick pattern and the hammer low bounced upwards exactly from the trendline and from the EMA's. If we see a continuing move upwards in the near future and if we manage to break above the triangle upper resistance line at $6,767, then the triangle pattern shows us that the ideal target point would be around $7,300 where several weekly resistances are.
In the bigger picture, the overall trend is down and that's why we think it is simple to break downwards. If we see a candle close below the blue line and below the triangle trendline, let's say around $6,420, then it would be a bearish confirmation. It confirms that the bullish momentum is gone and the strong support level doesn't work anymore and the next stop would be on the major counter trendline which is around $6,300. Be careful in this scenario!
Ethereum(ETH/USD) is still on the "Rising Wedge"
As Bitcoin, Ethereum trades currently between the two blue lines, support and resistance. The resistance line at $236 has been before a support and now it becomes a resistance.
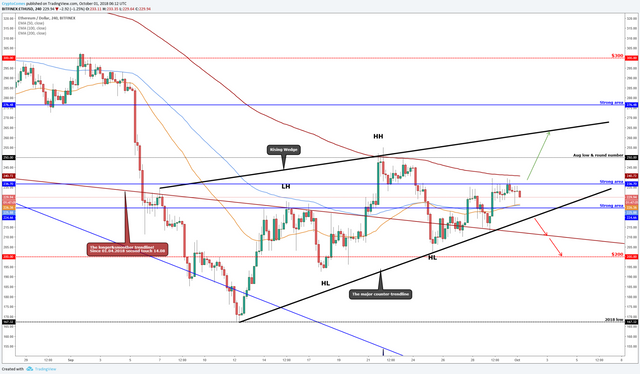
Several times it has tried to break above that blue line, but those attempts were unsuccessful. To break through this level, we have to fight with 200 EMA which starts to work as a strong resistance on the four-hour chart.
Ethereum shows nice short-term higher highs and higher lows since Sept. 25. This could show us that we have market structure and power to push the price upwards from the mentioned level and the next target would be around $260 where the minor trendline is.
The current support line has been historically a good S&R level and now it becomes a major support level again. To make this level even stronger then we trade above the 50 and 100 EMA's which should also start to work as support levels. If we break below that blue line and if we break below that major counter trendline then we have a bearish confirmation and the bearish confirmation is even stronger because we are on the continuation chart pattern called "Rising Wedge.” The overall market trend is down and if Bitcoin makes a breakout downwards from the triangle then Ethereum definitely makes a breakout downwards from the "Rising Wedge" and probably the next stop would be around $200. So, stay alert when you see at least a four-hour candle close below the major counter trendline which also breakout from the continuation pattern "Rising Wedge.”
Take a look at Cardano (ADA/USD) Price Analysis, Oct. 1, 2018
Have a nice day!