Bitcoin got a bullish candlestick pattern, EOS shows some stability, TRON is almost ready to make a breakout

Bitcoin got a bullish candlestick pattern
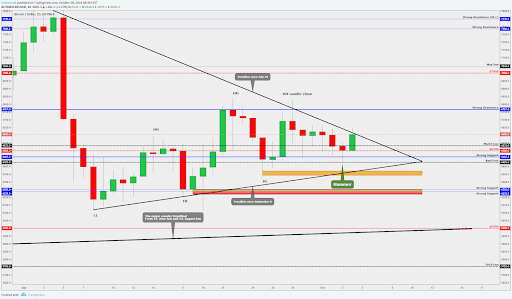
Yesterday was a very important day to find out what we can expect the next days. We reached as low as the April level at $6,425 and after that, the price quickly bounced upwards between the round number and the strong support at $6,460. Basically, we touched three important levels below the current price and we got a bounce, that gave us a nice daily candle close which was again above the $6,500. It is a very good sign because we touched pretty low levels and still, the bulls manage to push the price upwards above the round number and this 'jump' gave as also a bullish candlestick pattern called "Hammer.” The hammer also indicates that we can see a reversal.
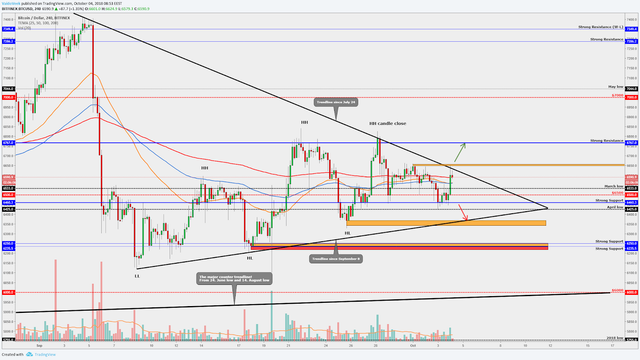
If we look at the four-hour chart (image above) then, after the daily candle close the price made a very powerful statement upwards. The close was above the EMA's, the volume oscillator MA (moving average) is nicely pointed upwards and most importantly, the altcoins followed this movement and they are also on the green side.
Currently, if we want to look the next resistances at the moment, we are on the pretty significant price area, the trendline area (pulled from July 24). The trendline and the latest resistance (orange 'line' above the current price) makes a crossing area. If we want to go to the higher prices then we have to break this crossing area. The break might open major resistance level at $6,767.
If we don't find that power and if the momentum doesn't last long enough then our well-known levels below the current price start to work as support levels. A daily and the four-hour candle close below the $6,450 will be the significant signs that those moves were just little ‘fakeouts’ and it confirms bearishness.
EOS (EOS/USD) shows some stability
EOS is currently on the short-term consolidation mode. After the September rallies, where it made new short-term higher highs, it had a little bit of a slow down.
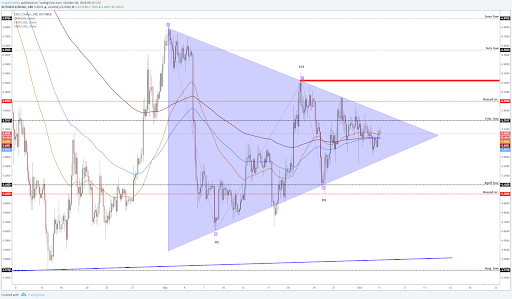
At the moment we could see that it is on the chart pattern called "Triangle" and the triangle tip is a bit far from us, which indicates that we might see a small movement from EOS.
Positive signs are: we still have higher lows on the price structure and the current price is above the EMA's. This will show that it slowly start gaining some power to push through the triangle and this breakout from the triangle is also our main focus.
To make a breakout, we have to fight with the triangle trendline and with the February low which works as a resistance, but that's not all because after the breakout from the triangle comes the round number $6 and then the latest peak (lower high) will start to work as a strong resistance level. So, pretty heavy levels above the EOS and to break through, firstly, BTC has to make a breakout from the trendline.
Take a look at TRON (TRX/USD) Price Analysis, Oct. 4, 2018
Have a nice day!