Bitcoin is above the current level of major resistances, Dash shows bullish signs, Ripple is a massive gainer
_1.jpg) *
*
Bitcoin is above the current level major resistances
Yesterday, we mentioned exactly a bullish confirmation area which was above the triangle upper trendline and above 100 EMA. The four-hour candle closed pretty precisely above those and as we mentioned, this shake off that happened the day before yesterday would give us a better accuracy on the confirmation areas from the technical perspective.
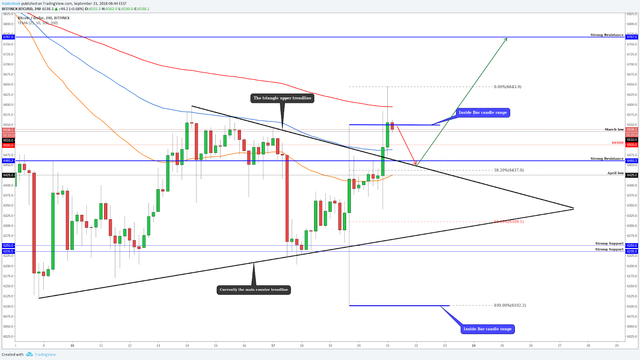
After the close, we got another bullish four-hour candle which closed above all our named resistances. Now, those resistances become the support levels, starting from the March low until the April low.
Currently, after the pump upwards, Bitcoin finds a resistance from 200 EMA but we have a good sign from the candlestick pattern called "Inside bar,” it means that if we break above or below from the main candle range it will show us current momentum. So, this massive candle and those candles afterwards created us "Inside bar(s)" and we did a breakout upwards (you can see the blue lines mark those places on the chart) which will indicate that the momentum could be upwards.
Now, when we have a little throwback from 200 EMA we could retest the lower levels. All throwbacks are healthy if we manage to stay above the triangle upper trendline which now also becomes a support level. The lowest point where we want to see another movement upwards is around $6,460. The bounce criteria from retest area:
There is the strong support level (blue line)
The triangle trendline
There is 100 EMA
Fibonacci retracement level 38 percent
All those criteria make a crossing area and start to work as strong support levels.
Obviously, there is room to reach higher levels. We want to name the first area where the price could stay in consolidation mode or could make a little throwback, it is around $6,766. There is another strong resistance level, the bigger Fibonacci 50 percent retracement zone and a trendline projection.
Dash made a bullish breakout
Dash has made a breakout from two triangles. The first bullish four-hour candle takes down the smaller triangle and the second candle takes down the bigger triangle (blue lines).
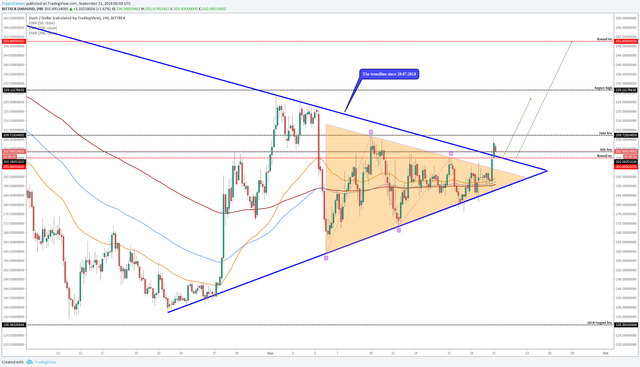
We have mentioned before how strong it looks and etc. Currently, as we said, it has two bullish signs but let's count all the bullish signs together, we have:
Upwards breakouts from the triangles
A break above the round number $200
Currently, we are sitting on the July low level which starts to work as a support because we broke above that level too
The golden cross between 100 and 200 EMA
So, those criteria will guide us to higher levels and the target areas could be around:
$225- the August high level which starts to work as a resistance
Currently, the main target would be around $250- semi-round number, the triangle pattern possible target, Fibonacci extensions.
Technically, Dash is very bullish, multiple bullish price action criteria matching each other means it is ready to climb into the main target area.
Take a look at Ripple Price Analysis, Sept. 21, 2018
Have a nice day!
Join Us
Refer your friends and earn rewards. Your referral link: https://deals.weku.io/pick_account?referral=ammar1
https://deals.weku.io/@r2cornell
@r2cornell Account
My Account
https://deals.weku.io/@ammar3
My Account