Bitcoin is on the edge, Litecoin is on the upwards channel, Ripple possible scenarios & targets

Bitcoin is on the edge
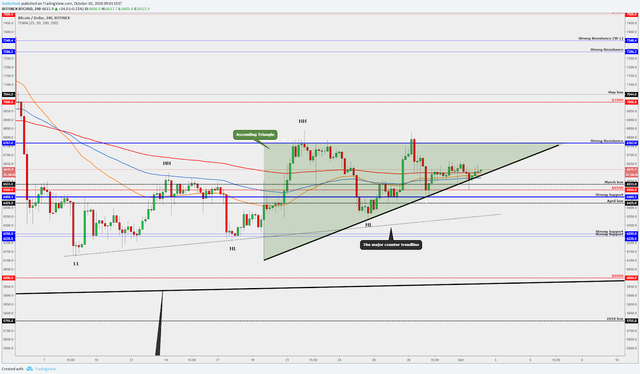
Bitcoin price slides on the triangle trendline. As you’ve seen on the four-chart, we don't have a candle close below the important trendline, the triangle trendline. Yesterday, the price touched exactly the round number area at $6,500 which worked nicely as a support, and it bounced quickly back to the triangle. This showed that buyers were alerted and they’ve caught this move pretty quickly and managed to push the price back above the trendline. After that, we have small green candles, but those small green candles are slowly climbing above the EMA's. We still have a golden cross between the 50 and 100 EMA's.
If we look at the daily chart again, we got a bullish candlestick pattern called "hammer" (hammers are everywhere), this is the second hammer in the three days period, and it shows that buyers have the power to hold the price up even if sellers tried to push it down multiple times.
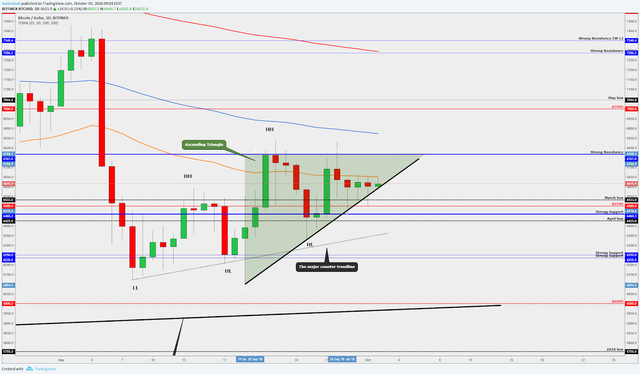
Now, here is a question- do the bulls have the power to hold the price up and can they start climbing higher or are they out of steam? Maybe the bears are finally winning the battle, and soon we will see a candle close below the trendline? The candle confirms that the bears dominate the market at the moment and we can possibly witness a leg downwards. We are really on the edge, and anything can happen, but technically it looks more bullish than bearish.
Litecoin (LTC/USD) is on the upwards channel
Litecoin looks 'healthy' with the upwards channel and with the clean higher highs (HH) & higher lows (HL). Currently, LTC price has found a good support area from the round number at $60. This area matches exactly with Fibonacci retracement 50 percent. Two times tested ($60) and two times it got a bounce upwards. The EMA's are around the round number area and that makes this support level even harder to break.
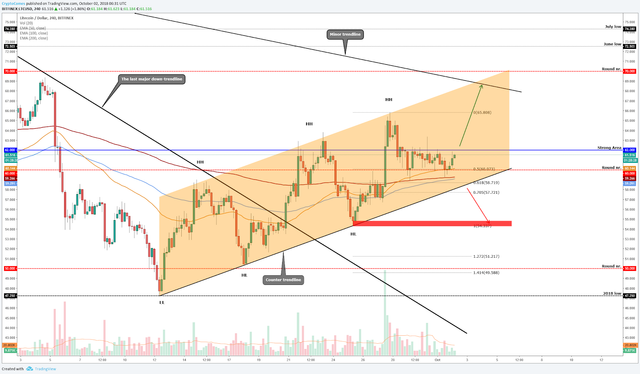
We have a golden cross between 200 and 50 EMA, which also indicates that we are on the bullish mode but at the moment. In order to get a leg upwards, we have to break the blue line, the strong resistance area.
Lately, six attempts failed, and it shows that if we want to be bullish then firstly, we have to take down the blue line which works as a resistance. The target would be slightly below the $70 where the minor trendline and the channel trendline crossing area plus the round number are. All those might work as a resistance, and the first short-term target should be there.
The bearish confirmations would be a candle close below the round number $60, a candle close below the channel trendline (counter trendline) and probably the first stop is around $54-$55. These are the latest support level and previous higher low.
Take a look at Ripple (XRP/USD) Price Analysis, Oct. 2, 2018
Have a nice day!