Bitcoin is technically good to make another ‘leg’ upwards, Monero is getting ready for breakout, Ethereum is in trouble

Bitcoin is technically good to make another ‘leg’ upwards
Yesterday was bullish-day and the "Hammer" worked nicely as a bullish pattern. BTC price found a resistance from the trendline which is pulled from July 24. Several attempts in the lower time frames to break upwards have failed, and currently, it makes a healthy little throwback (movement downwards). Healthy, because after impulse wave (yes, this is tiny impulse) there is always a correction before we can start another movement upwards.
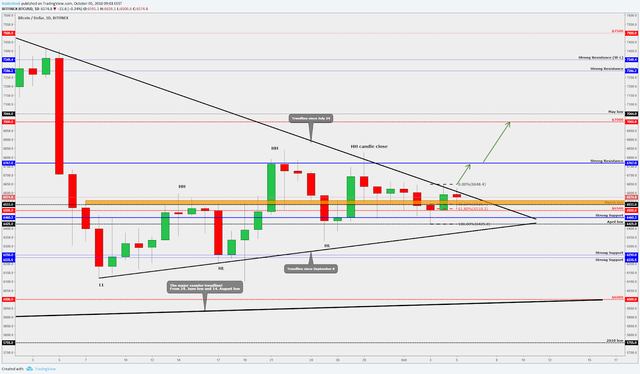
The current correction has founded a support from the golden Fibonacci ratio at 62 percent, and we discovered a very strong area on the chart between the $6,530-$6,550 (marked with the orange 'box'). This area has worked historically as a strong support and as a strong resistance and no single candle close inside this orange area, only powerful candles through the area up-and-down, this makes this area super strong. If the current scenario holds us, then there is almost a perfect starting point to go to the higher levels.
First bullish confirmation is a trendline breakout, if we get at least a four-hour candle close above the trendline then it could mean another leg upwards to the next strong resistance at $6,767.
Let's count down all the bullish price action criteria:
Oct. 3. we got a bullish candlestick pattern "Hammer"
Yesterday (Oct. 4) we got a nice impulse upwards
Current throwback has found a support from the golden Fibonacci level at 62 percent
Current throwback has found a support from the super-strong area
So, technically Bitcoin is ready to break that trendline!
To confirm bearishness then the candle close below the orange area will guide us to the lower levels and the full bearish confirmation is then when we also get a candle close below the $6,460 (blue line).
Monero (XMR/USD) awaiting breakout
Monero looks a little bit suspicious and looks like it needs to wait a moment and for the opportunity to break upwards from the triangle.
456.png)
Currently, there have been several attempts to break through the counter trendline, but it has held the price nicely. Slowly, XMR’s move into the triangle tip to explode and if Bitcoin makes a move upwards and it breaks the trendline then definitely Monero has waited the perfect moment to do the same. At the moment it trades above the 200 EMA on the four-hour chart.
The counter trendline and the 200 EMA make together a strong support area below the current price. So, the only way that we could see a Monero coming down is if the BTC can't break that resistance and starts to come down, a candle closes around $6,450. In this case, we can say that Monero comes down also but currently, doesn't looks like that.
For breakout from the upper trendline, there are two target areas at $128 and $140. Those are the recently worked resistances, and we would recommend to take out some profits in this area because around $150 is just hell. There are multiple monthly supports and resistances that you never want to be on Monero if we reach into this area. The bounce downwards could be probably massive if the scenarios matching each other.
Take a look at Ethereum (ETH/USD) Price Analysis, Oct. 5, 2018
Have a nice day!